
Mar 14,
2018
How big is your carbon footprint? Getting the full picture can be difficult. We have a sense of the emissions we produce directly, when we drive our cars or cook with gas, for example. Emissions we produce indirectly are less obvious, but they’re still “embodied” in the goods we buy. One of the biggest sources of embodied emissions is food, which accounts for about one-third of global greenhouse gas emissions (GHGs). So just how much carbon does it take to produce and transport a can of pop, a loaf of bread, or a scoop of ice cream?
The answers might be surprising. They’re certainly complicated. But thinking about the complexity of indirect emissions also helps illustrate how carbon pricing works.
Let’s give ourselves an easy frame of reference: Burning a litre of gasoline produces about 2.3 kilograms of carbon dioxide. Say you drive a car with a 50 litre tank and fill up twice a month. That’s about 3 tonnes of GHGs a year (per-capita, Canadians produce about 20 tonnes a year). Those are the direct emissions. You turn your vehicle on; the gasoline combusts and produces CO2.
There are also indirect emissions that result from refining and transporting gasoline, but combustion accounts for the majority (about 70% to 80%).
Those indirect emissions are the focus of this blog. What about the people who turn on machines and vehicles so they can make food and bring it to you? This gets complex. We need to think about the carbon in the food itself, plus the carbon in the materials needed to make the food, plus the transportation. But we’ll break it down slowly.
Let’s take a trip to the supermarket!
The production process for every can or bottle of Canada’s favourite ambiguously-flavoured cola is virtually identical. This makes it a bit easier to calculate their embodied emissions. So how much carbon is embodied in Coke?
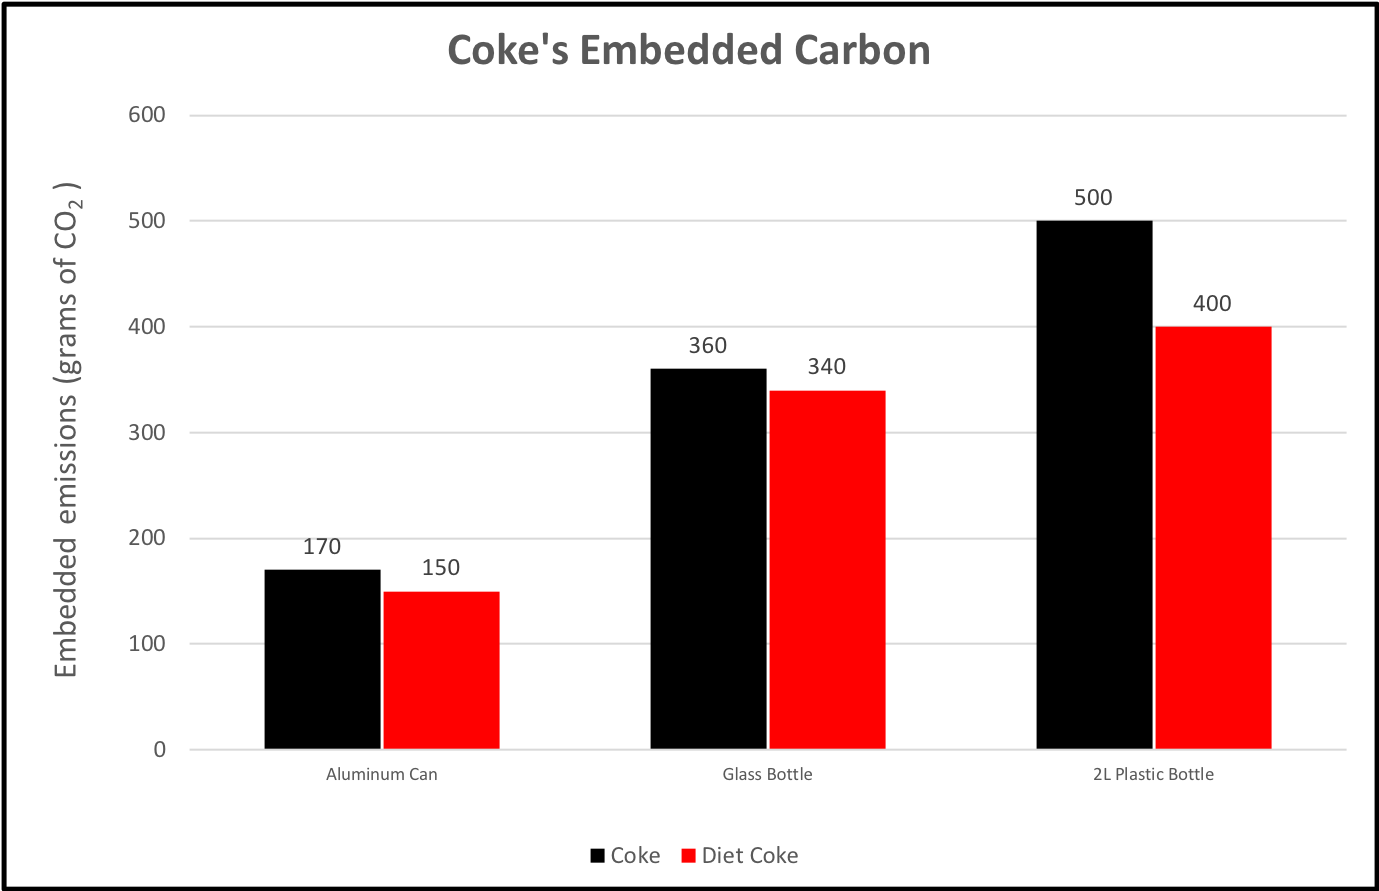 Source: Coca-Cola, Carbon Trust
It depends on the container! There are two components to unpack. There are the GHGs from the drink itself (production and fizz). Then there’s the packaging, which accounts for anywhere from 30% to 70% of the emissions. Producing glass is more energy intensive than producing aluminum. A 2 litre plastic bottle produces the most emissions overall, but the fewest on a volumetric basis.
Interestingly, Diet Coke is less emissions-intensive than regular Coke. Better for your teeth and the climate!
Bread is more complicated. A global food staple, each loaf contains about 500 grams of embodied GHGs. It’s complicated because we need to consider both the upstream emissions (i.e. farming), and upstream of the upstream (i.e. fertilizer manufacturing).
Fertilizer is the biggest component. Manufacturing is emissions intensive and generally relies on natural gas. It accounts for about 40% of bread’s total embodied emissions. The rest come from farming and baking, with legs of transportation sandwiched in between. Bread sales are worth about $3.5 billion in Canada (price fixing included!). That’s a lot of emissions.
You can find the excellent study I relied on for these numbers here.
Making ice cream is a serious endeavour. First you need to grow the feed for the cows who produce the milk (a fair amount of GHGs). Then you need to pasteurize and transport the milk, then manufacture and transport the ice cream, and keep it cold the entire time.
So how much CO2 does this all add up to? Canada has very good data, and it turns out that geography matters.
For a kilogram of ice cream, the GHGs range from 1.8kgs in Manitoba to 2.8kgs in Alberta. The Canadian average is 2.1 kilograms. It may seem like a lot, but it has nothing on butter, which contains 7.3kg of GHGs per kilogram.
But kilograms are kind of awkward; we buy our ice cream by the litre. If we convert the Canadian average into volume, we get about 3.8kg of GHGs per litre.
That’s right, there are more GHGs in a litre of ice cream than a litre of gasoline.
As we’ve seen, we’re a step (or several) removed from embodied emissions. It’s easy to forget that they’re there. A recent report showed that cities underestimate embodied emissions for goods consumed within their limits by about 60%. Supply chains are complex, and carbon accounting is extremely difficult.
How to account for all of this complexity?
We can use carbon pricing. It works for both consumers and producers. Consumers have choices in the supermarket. They can switch to foods with lower carbon costs (by buying local, for example), but they don’t have to change their choices at all. Firms who fully understand their supply chains, can switch to lower-carbon options at every step in that chain. And it will save them money and make their products cheaper.
There are a few caveats. First, these system-wide incentives work best when carbon pricing covers more GHGs. When some emissions aren’t covered — in agriculture, for example — there’s no incentive to switch to lower-carbon options. Second, supply chains often cross international borders. Markets won’t pass on carbon costs if prices for goods are set internationally, rather than domestically. As more and more countries take action on climate policy, this issue will become less important. In the meantime, we can design policy to address this competitiveness problem.
Reducing emissions doesn’t mean doing all of this intricate accounting when we shop. Prices can do it for us. We just need them to tell us the truth.


1 comment
Yes, cradle to cradle, the WHOLE lifecycle
Comments are closed.