
Apr 15,
2015
Every so often, the research team here at Ecofiscal will venture out into the blogosphere. Sometimes, we’ll share additional analysis that didn’t quite make it to a report. Sometimes, we’ll elaborate on more technical ideas or data that the main reports consider only briefly. And sometimes, we’ll just take the opportunity to be unabashedly #wonkish. So be warned: here be graphs.
Assessing existing provincial carbon pricing policies is a key part of The Way Forward, the Commission’s first report on carbon pricing. This blog will take a closer look at stringency, a fundamental design choice for carbon pricing policy, and how different stringency choices compare in BC, Alberta, and Quebec.
As we describe in the report, the stringency of a policy is a measure of how ambitious it is in terms of incentives for reducing GHGs. As others have noted, stringency matters. Just pricing carbon isn’t sufficient: the price must be high enough to create incentives for emissions reductions and innovations that align with stated ambitions.
To illustrate, consider a simple conceptual model, as per the figure below.
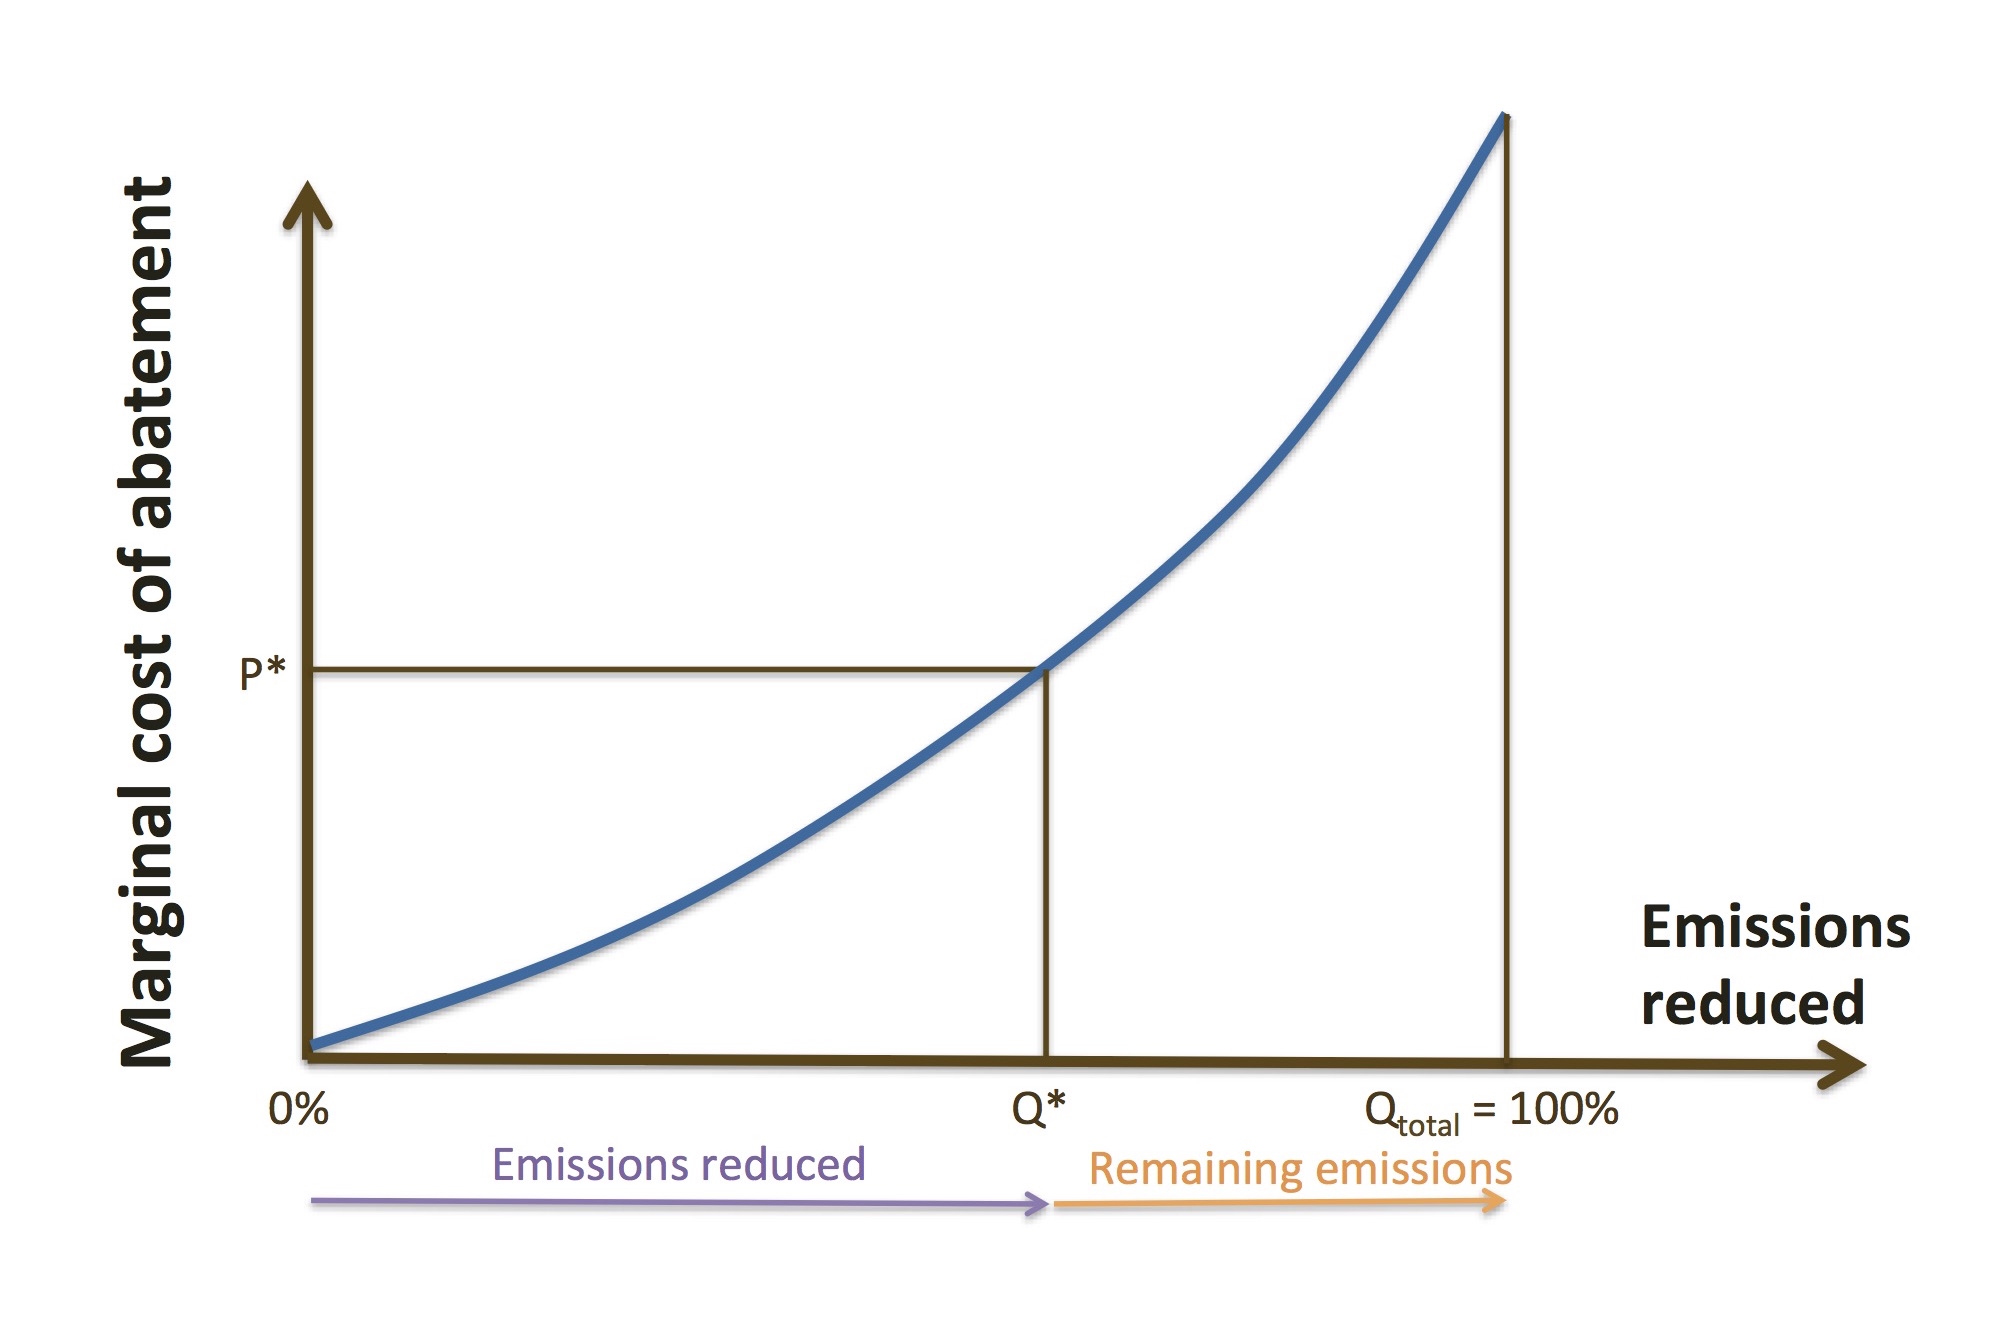 The figure shows a marginal abatement cost curve for a given province. The horizontal axis is the level of emission reductions, from zero to one hundred percent. The vertical axis is the incremental, or marginal, cost of each additional tonne of GHG reduced. Marginal costs increase with deeper reductions: the first emissions reductions are inexpensive (the so-called “low-hanging fruit” of emissions reductions). But deeper reductions require increasingly expensive reductions.
A carbon pricing policy sets the marginal price of carbon (that is, the market price) in different ways. BC’s carbon tax sets the price (P*) directly via the tax rate at $30 per tonne CO2e. Quebec’s cap-and-trade, on the other hand, sets the quantity (Q*) of emissions to be reduced via the cap, and the price emerges from a combination of the market and the price floor established by the system. At the last auction, the price was about $15 per tonne. Alberta’s Specified Gas Emitters Regulation (SGER) is a flexible intensity standard, and defines the marginal cost of carbon by setting a maximum price of $15 per tonne via contributions to its Technology Fund.
Existing emitters seeking to maximize profit make decisions on the margin, so the marginal price matters a lot in terms of how effective a policy will be in driving emissions reductions. Under each of these policies, firms and households will reduce emissions as long as the marginal cost of doing so is less than the market price.
But the price of carbon isn’t the only way to meaningfully think about stringency. The average cost of carbon measures the costs that emitters incur as a result of policy.
Average costs matter as a metric of stringency in two ways. First, they affect decisions about new facilities: when a firm must decide whether or not to build a new power plant, for example, it’s not only the incremental cost of the final tonne of carbon associated with the plant that matters, but all emissions costs. Take a look at Andrew Leach’s writing on this issue in the context of Alberta.
Second, average costs determine the overall scale of the costs of policy for firms. If average costs are very low it may not be worthwhile for large firms to optimize their emissions reductions to minimize costs, even if marginal costs are high. Under low average costs, it may simply be easier (and cheaper) to pay the carbon price.
But what do we mean by average costs in the contexts of BC, Quebec, and Alberta? Back to our model! In the figure, average costs of the policy correspond to specific areas in the figure, as I explain below.
 For the BC carbon tax, two main elements define the average cost.
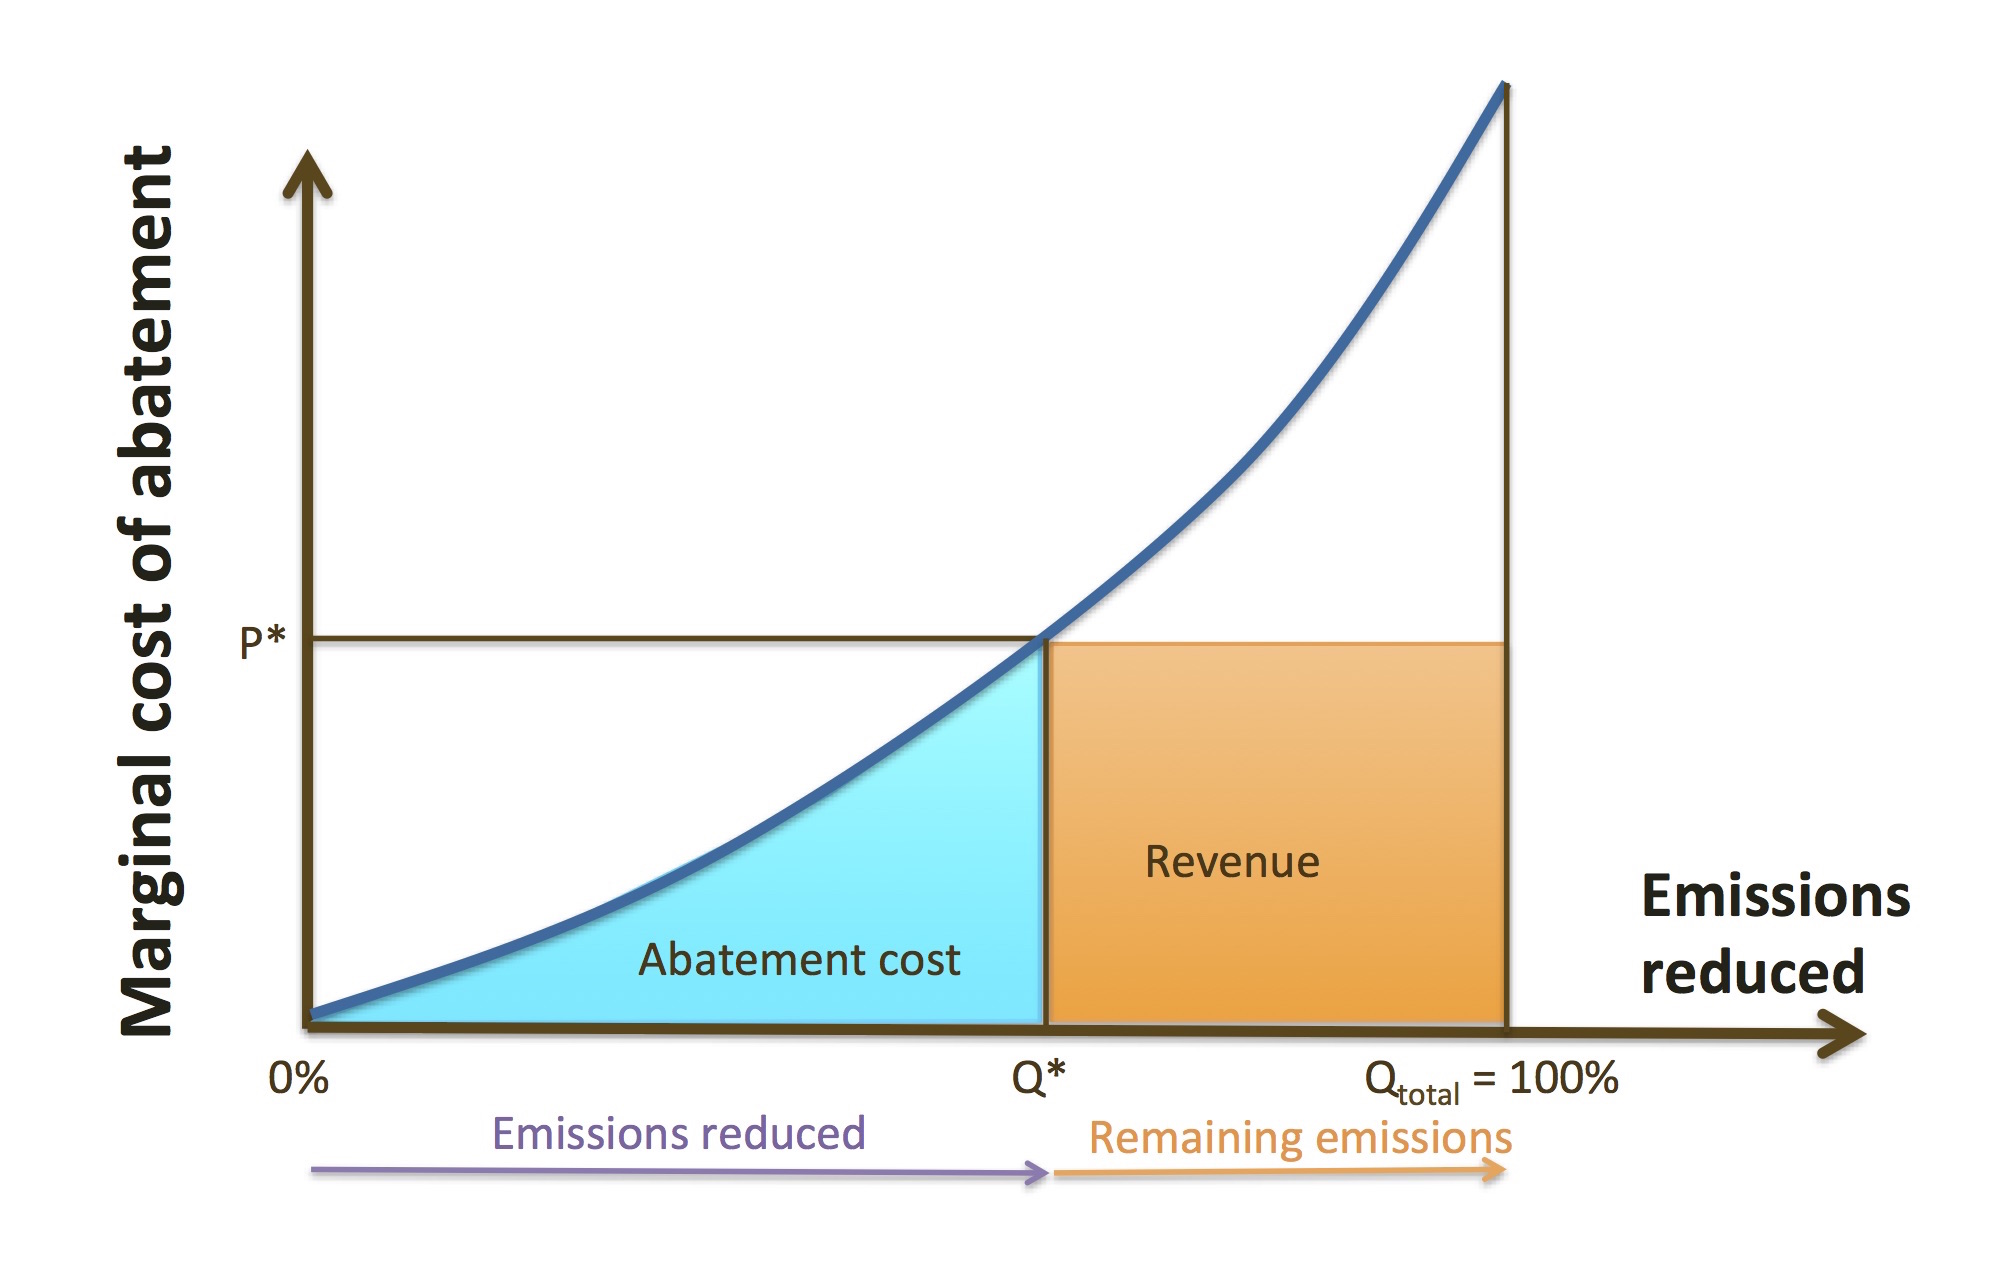
First, the blue triangle is the total costs that emitters pay in reducing Q* emissions, or the abatement cost. As noted, some of these reductions are relatively cheap — perhaps switching to energy efficient LED light bulbs or replacing coal-fired electricity with gas. All cost less than the price of carbon, P*.
Second, the orange rectangle reflects the total costs of remaining emissions (i.e., the emissions that are still being produced, after policy leads to Q* emissions reductions). Under a carbon tax, emitters pay the tax on all of these remaining emissions. Under a tax, this area therefore also represents the revenue generated by government.
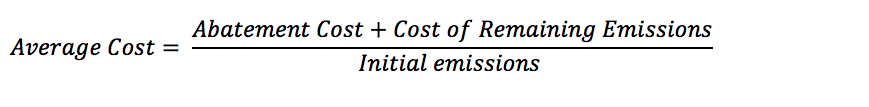
The average cost of the policy is therefore the size of these two areas divided by the initial level of emissions (that is, the levels of emission that would been produced in the absence of the policy, or QTotal in the figure),
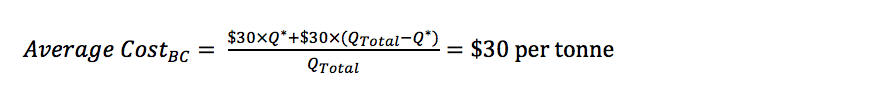
In the case of BC, we don’t know the precise size of Q*. Analysis suggests that BC’s emissions have declined more than other provinces since the carbon tax was implemented, but we don’t really know what emissions would have been in the absence of the policy. To simplify, our calculation for BC we therefore assume that all abatement occurred at exactly $30. Rather than a triangle, we think of the abatement as a rectangle. This leads to an overestimate, but in reality Q* is only a small share of total emissions, so the error is relatively small. Now, we estimate average cost as:
We can explore the stringency of Quebec’s cap-and-trade system and Alberta’s SGER in similar ways. These systems add a third element to the average cost story, as per the figure below. Emitters only pay for sub-set of remaining emissions.
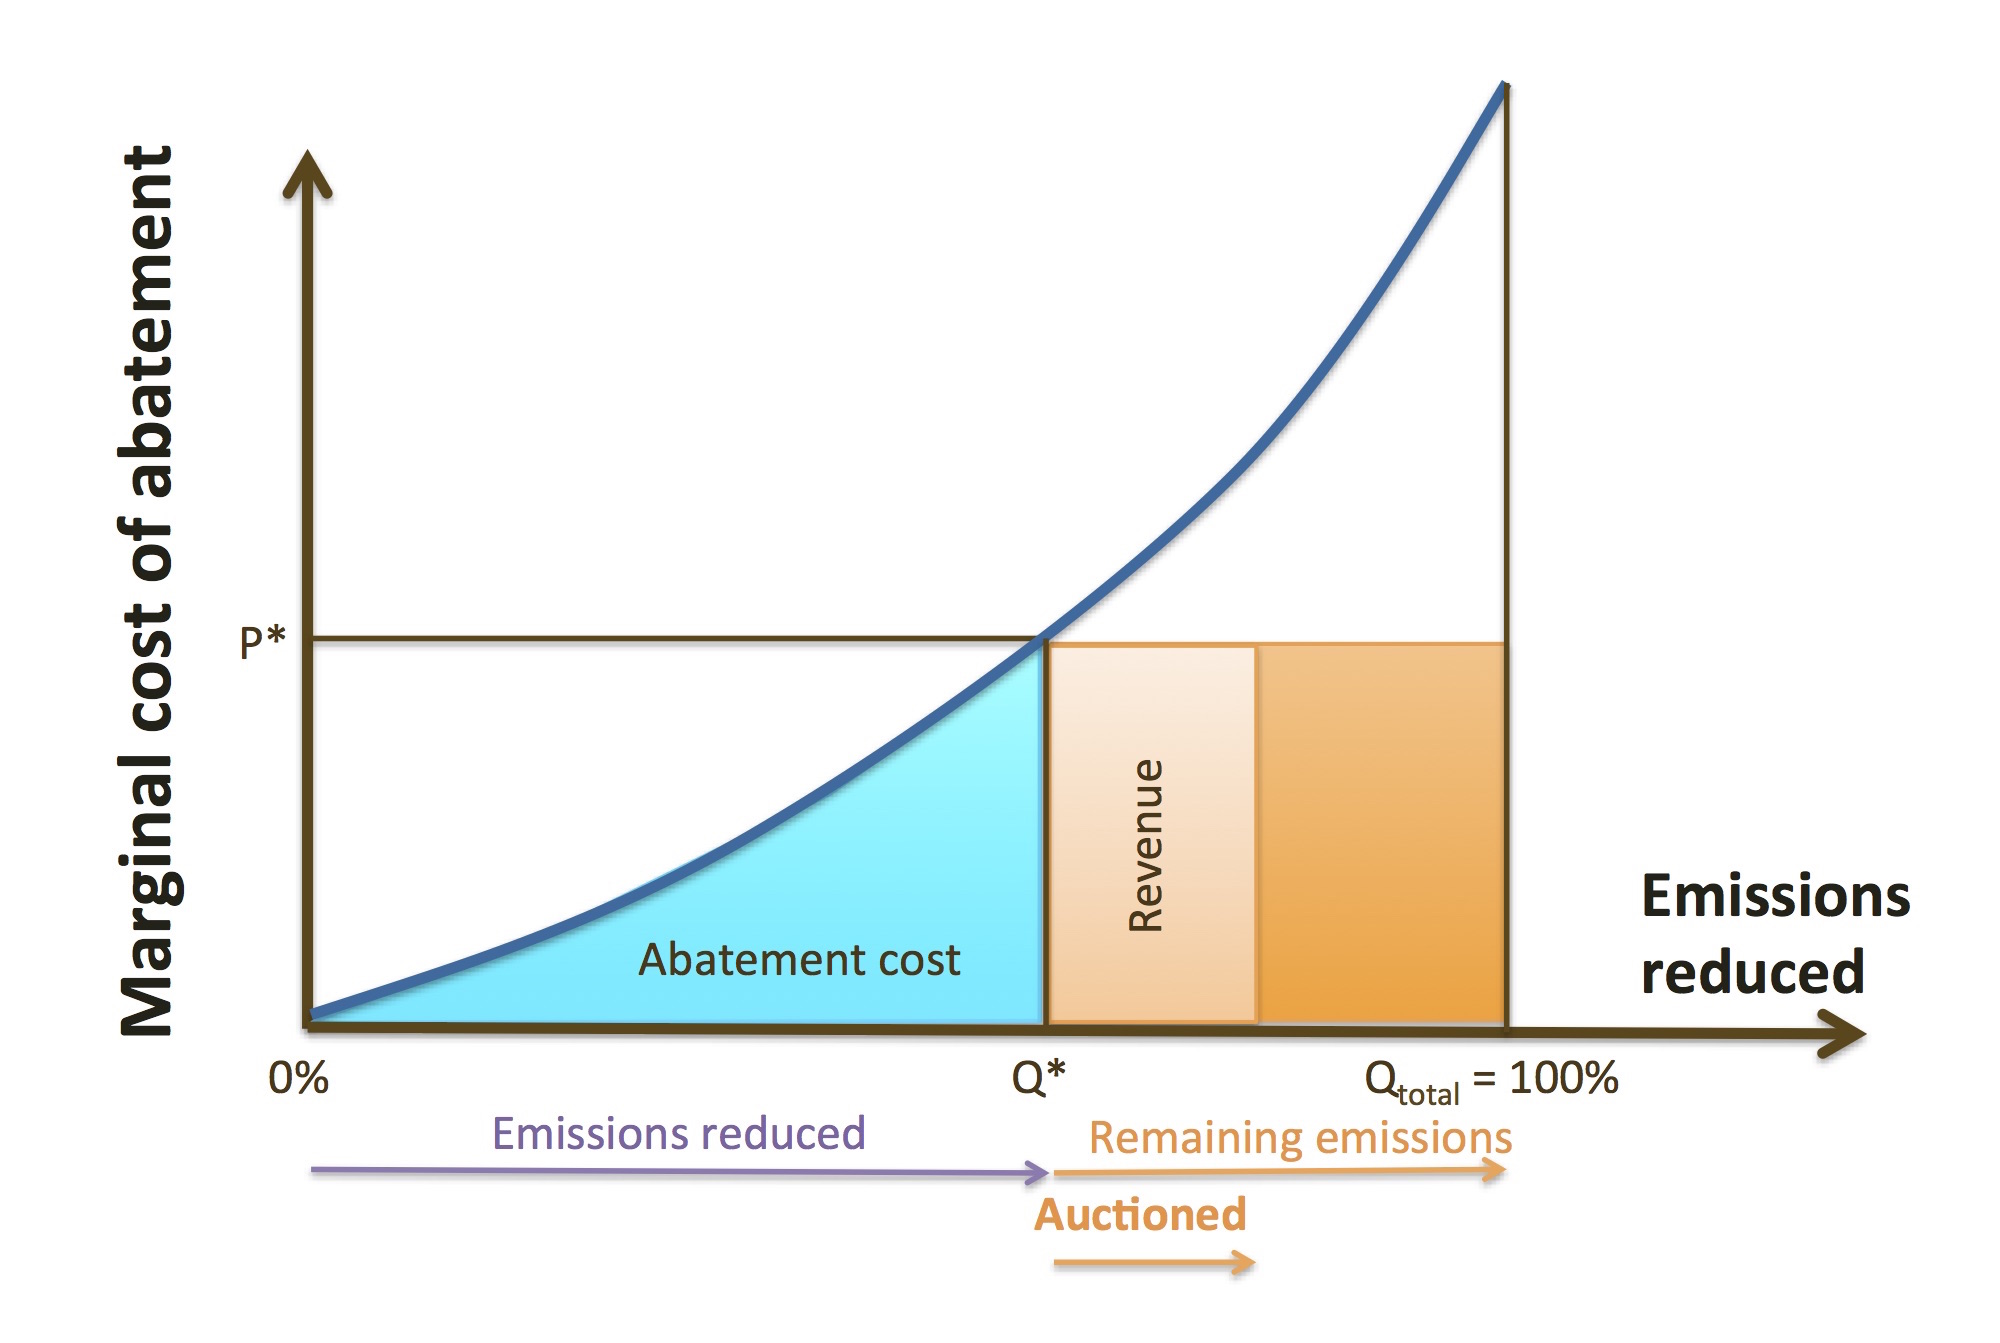
In the Quebec system, only some emission permits are auctioned, while others are provided to industrial emitters for free. The average cost can then be calculated as:
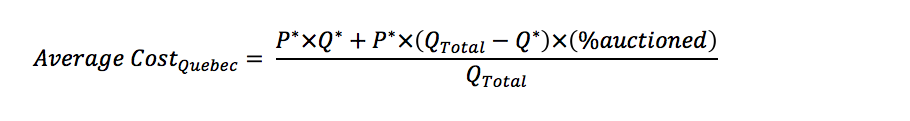
In 2015, the market price of carbon was about $15 per tonne. And we know that the Quebec cap for 2015 is set at the expected “business as usual” emissions — i.e., no reductions were required by the cap, for this early learning period of the system, making Q* approximately equal to zero. Permits are provided for free for at least 25% of emissions. As per BC, we assume that all abatement would occur at the market price of carbon. As a result:

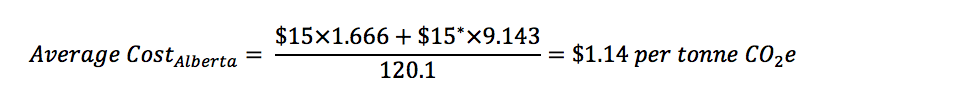
Alberta’s SGER is actually analogous to a cap-and-trade system in which permits are provided for free. Under the Alberta system, emitters pay the price of carbon only on emissions that exceed a benchmark of a 12% improvement in emissions intensity, or the compliance obligation imposed by the policy.

To estimate the average cost of carbon for Alberta, we can draw on data collected by the Alberta government based on actual performance of the SGER. In 2012, reductions at covered facilities amounted to 1.666 Mt CO2e, while the compliance was 9.143 Mt. Total direct emissions were equal to 120.1 Mt. Again, we assume that all abatement—and all compliance on remaining emissions—occurred at the maximum $15 per tonne, recognizing that this is an overestimate. As a result:
Overall, three main implications for policy emerge from this breakdown:
First, the three policies are quite different in stringency. BC has the highest carbon price and average carbon cost. Quebec and Alberta have almost the same marginal price, but Quebec has higher average costs of carbon.
Second, this story isn’t static in time. Quebec stringency, in particular, is set to rise. Over time, the price will increase as the cap declines and the minimum auction price increases. The average cost of policy will also increase both as the price increases and the share of free permits declines. New policy seems imminent in Alberta, which may increase stringency as well.
And finally, the differences in these calculations highlight the differences in the policy architecture in each province. Yet even though the price of carbon is imposed in different ways, we can compare the stringency of the policies. In other words, there’s more than one way to skin the carbon pricing cat… but no matter what the policy tool, stringency matters.

Comments are closed.