Figures & Tables

Figures

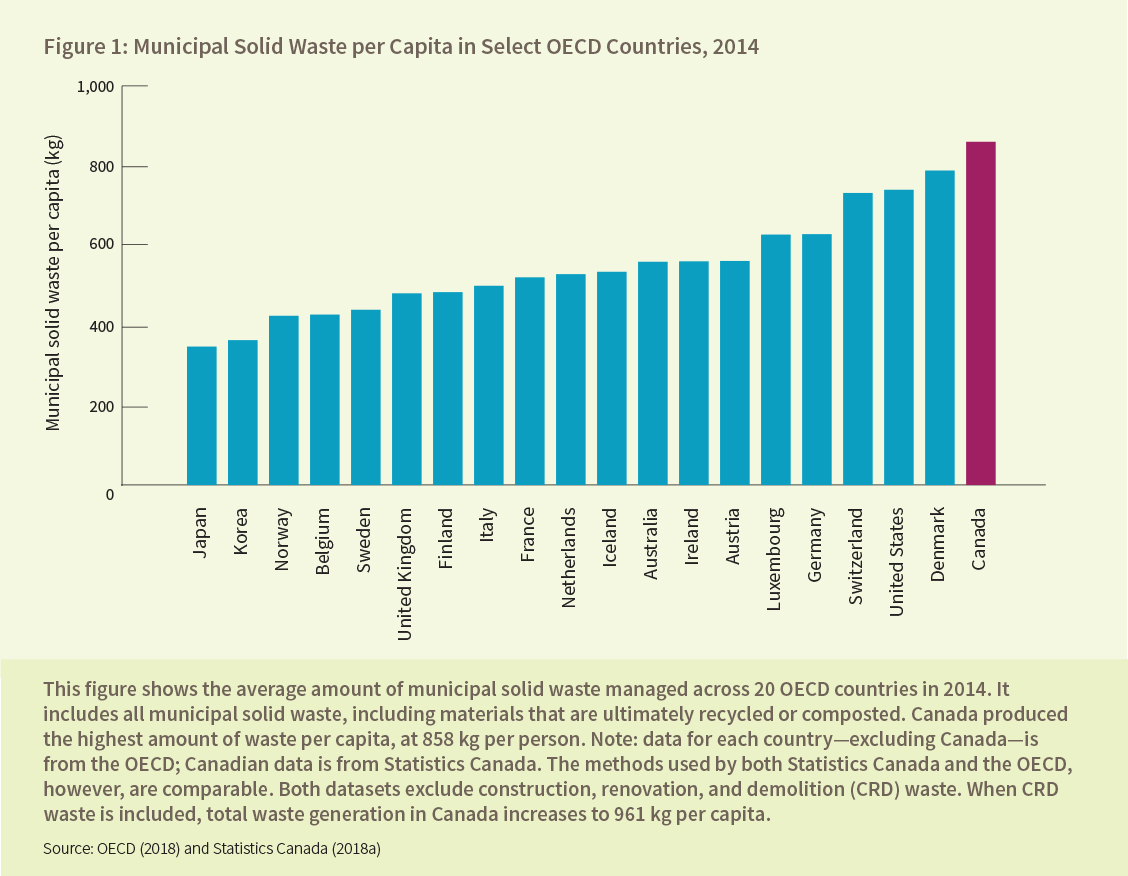
Municipal Solid Waste per Capita in Select OECD Countries, 2014
Figure 1: Municipal Solid Waste per Capita in Select OECD Countries, 2014
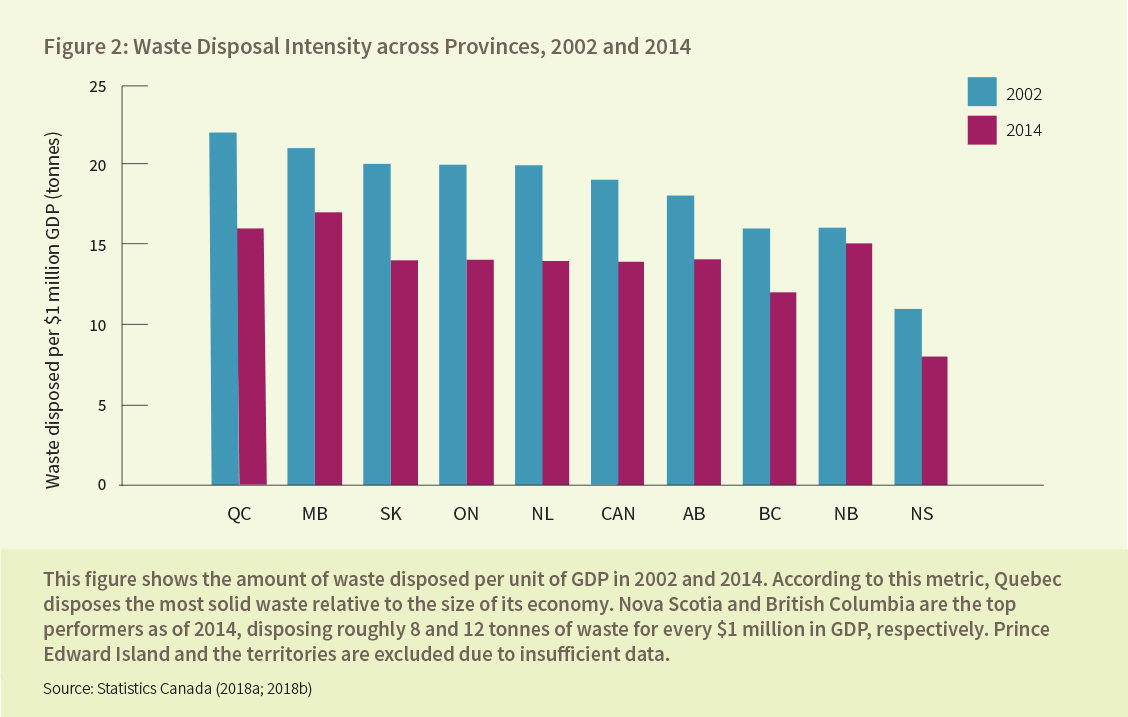
Figure 2: Waste Disposal Intensity across Provinces, 2002 and 2014
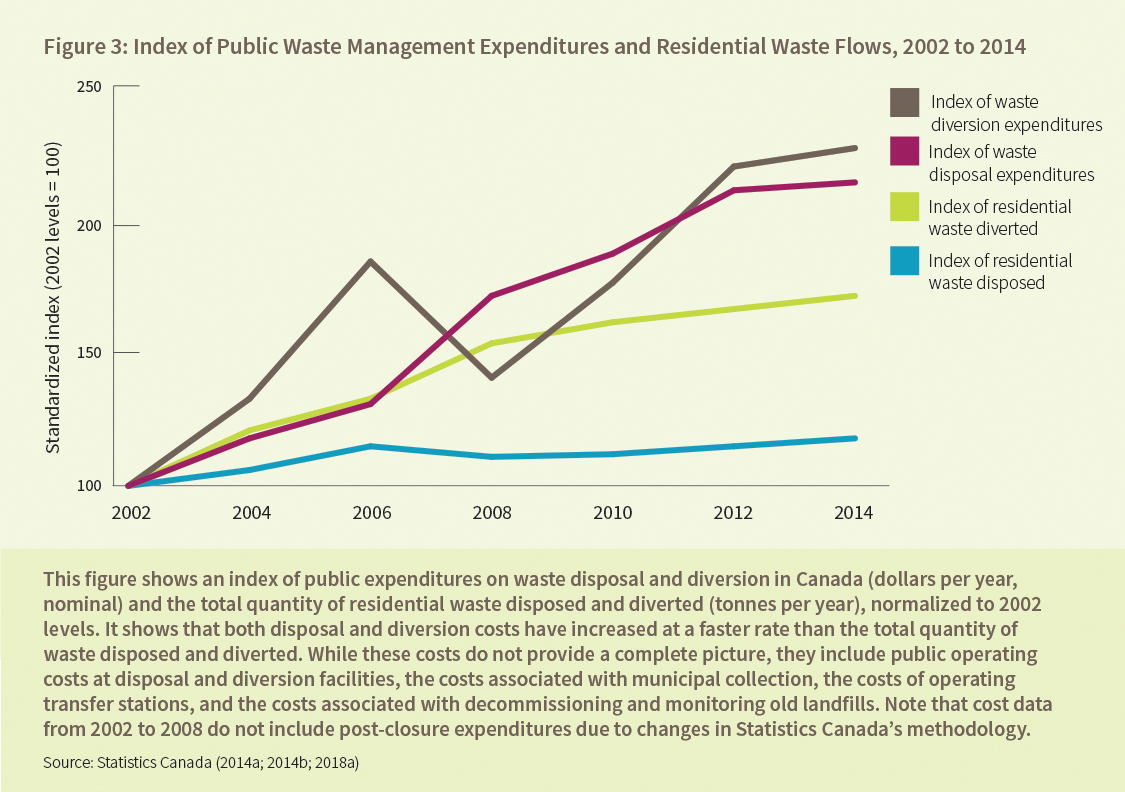
Figure 3: Index of Public Waste Management Expenditures and Residential Waste Flows, 2002 to 2014
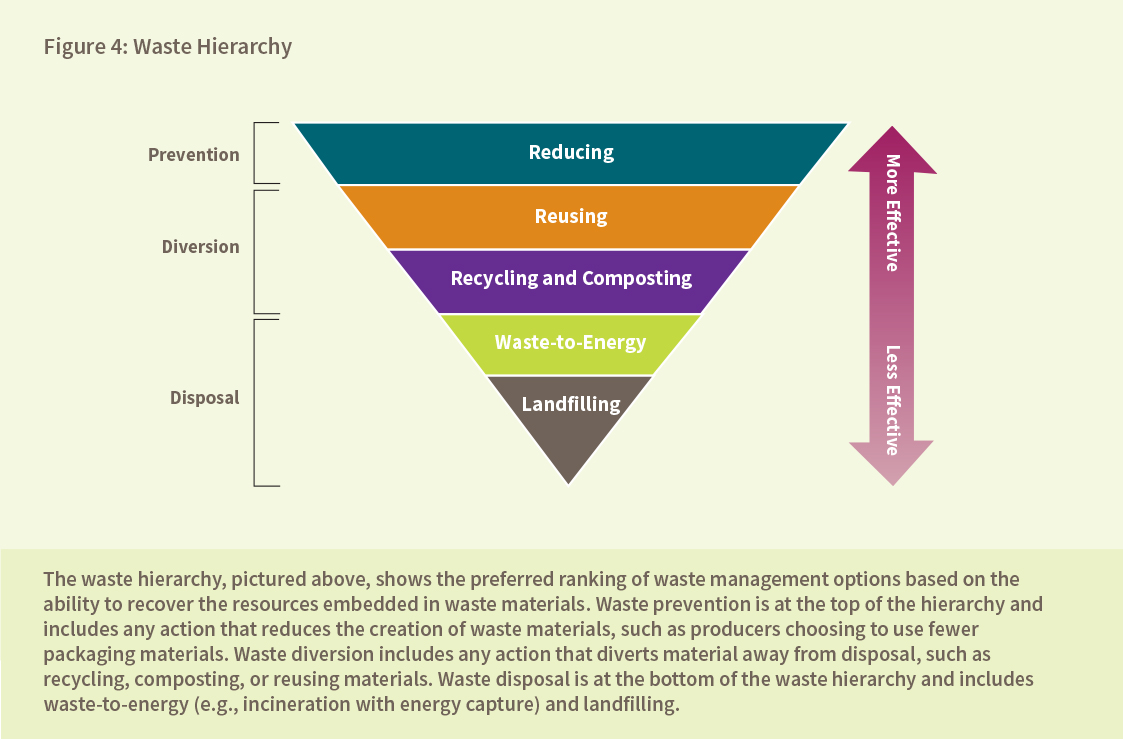
Figure 4: Waste Hierarchy
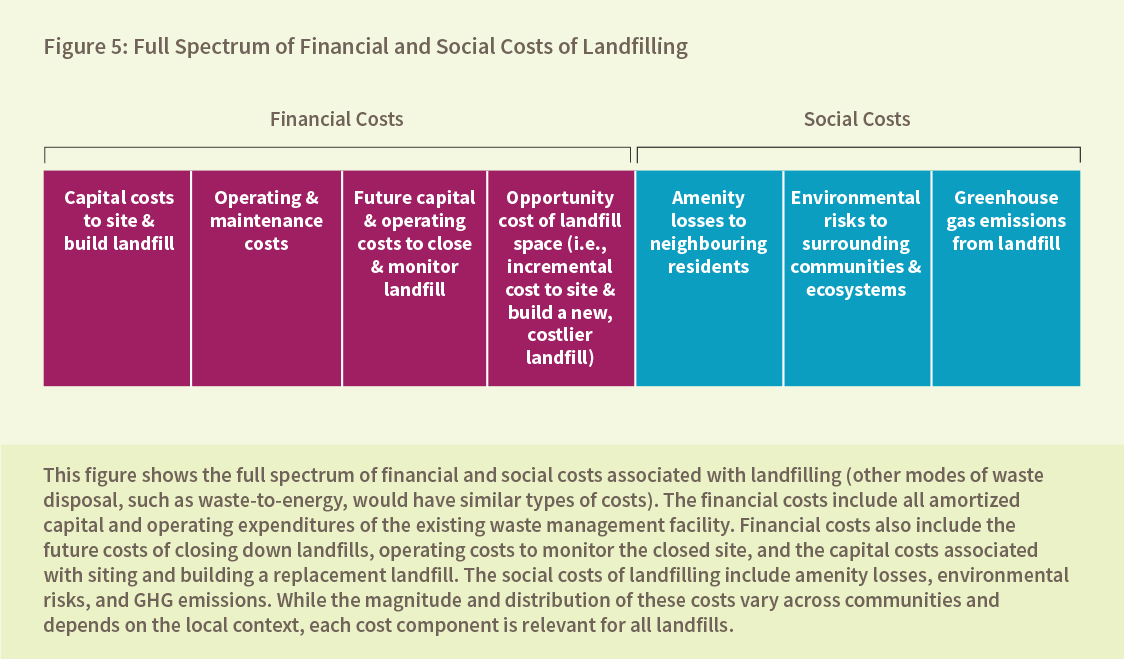
Figure 5: Full Spectrum of Financial and Social Costs of Landfilling
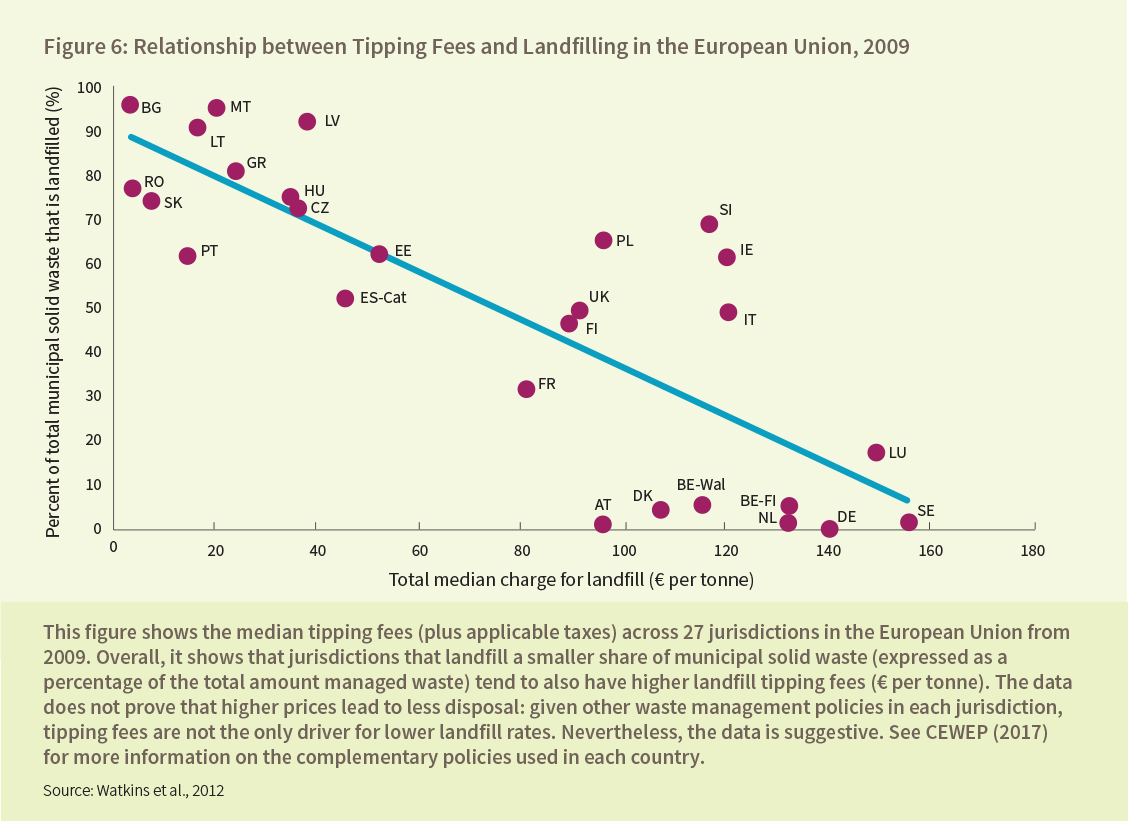
Figure 6: Relationship between Tipping Fees and Landfilling in the European Union, 2009
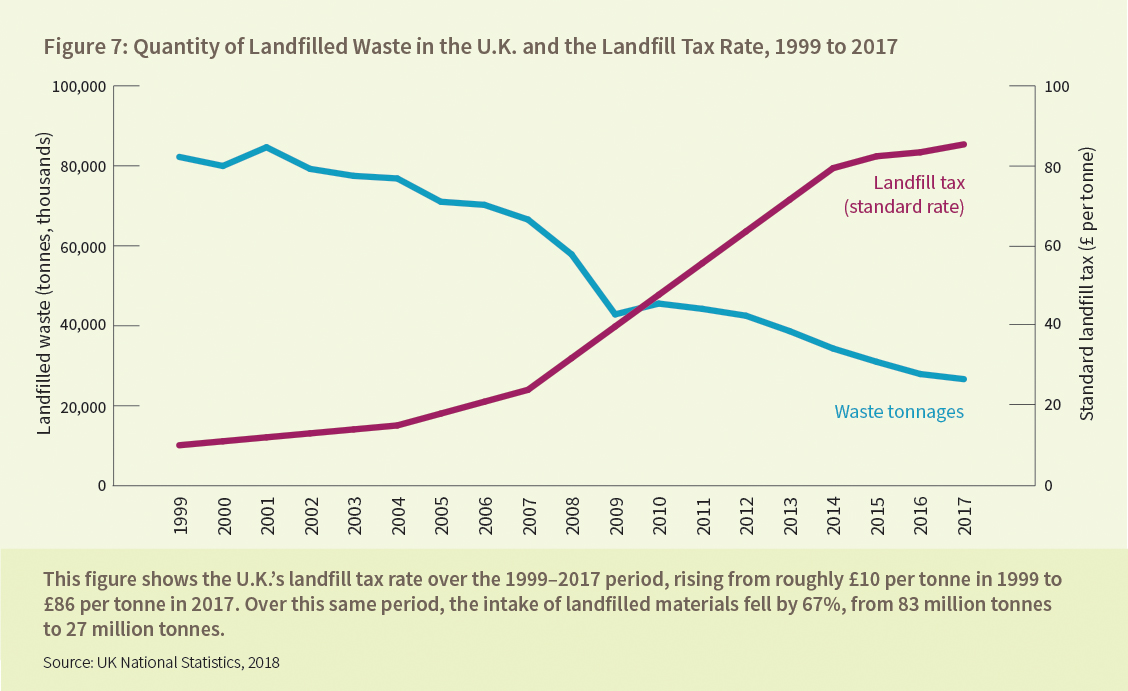
Figure 7: Quantity of Landfilled Waste in the U.K. and the Landfill Tax Rate, 1999 to 2017
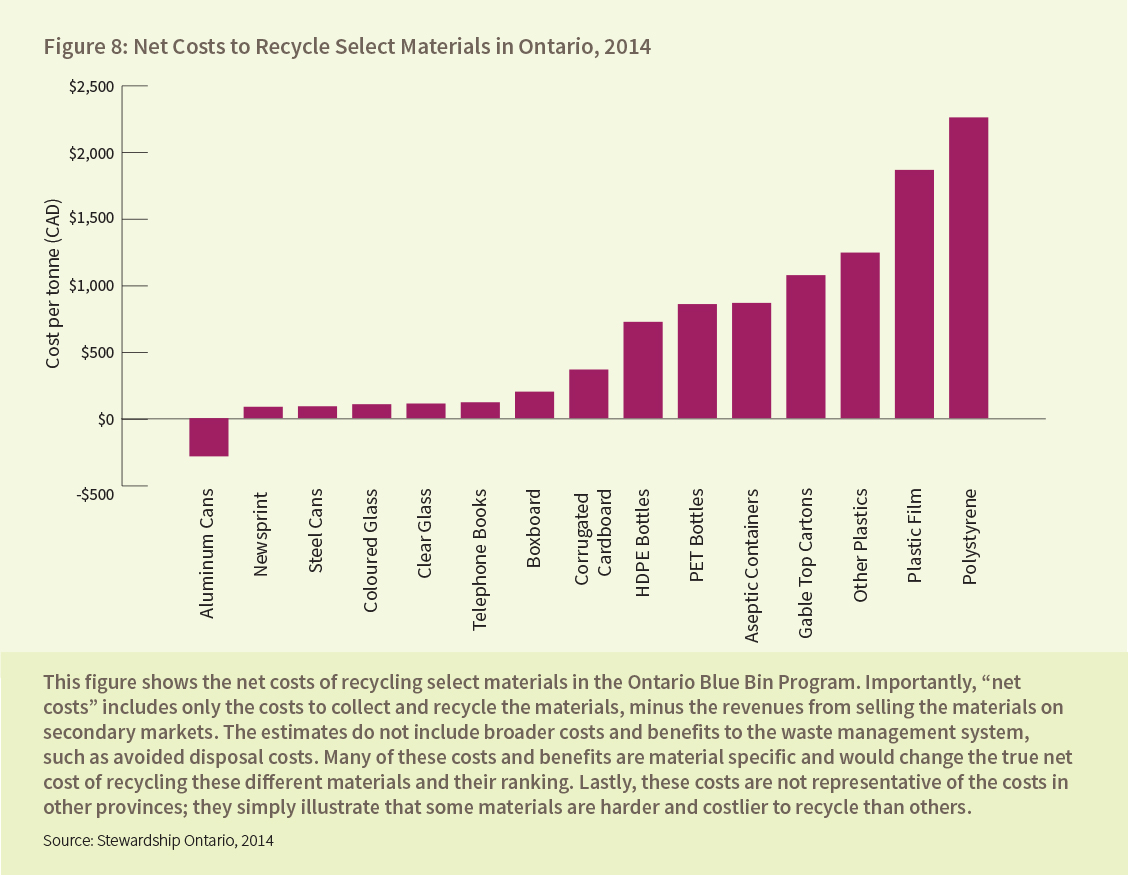
Figure 8: Net Costs to Recycle Select Materials in Ontario, 2014
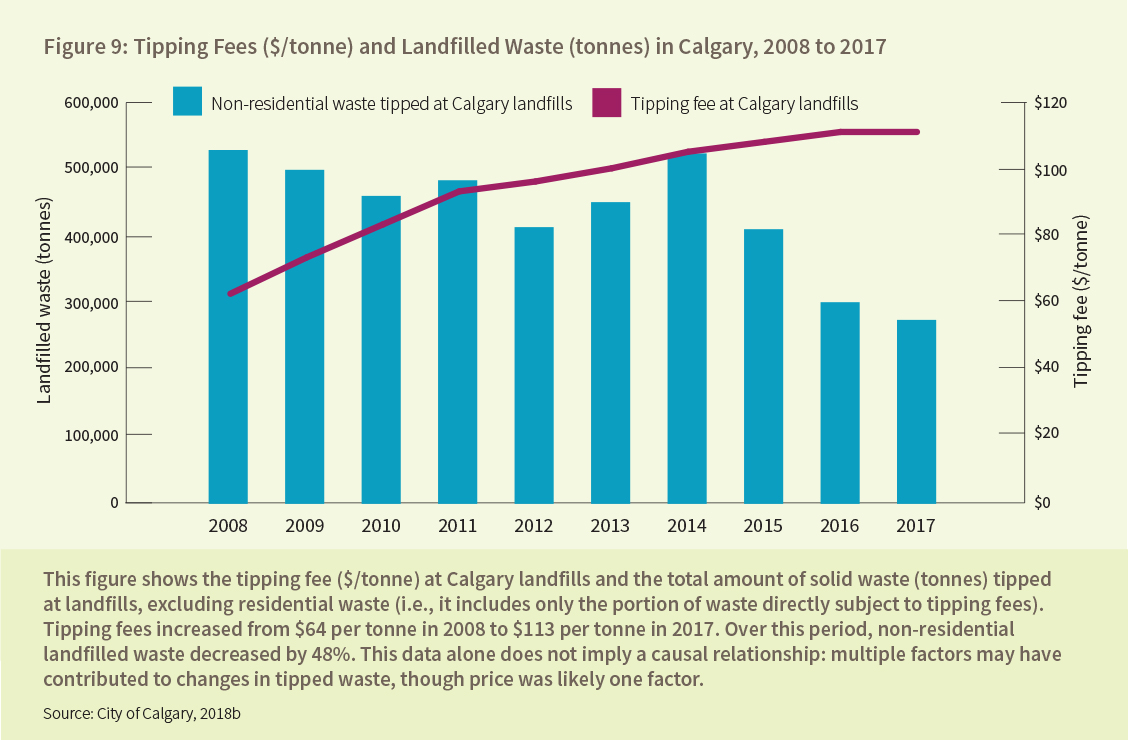
Figure 9: Tipping Fees ($/tonne) and Landfilled Waste (tonnes) in Calgary, 2008 to 2017

Tables

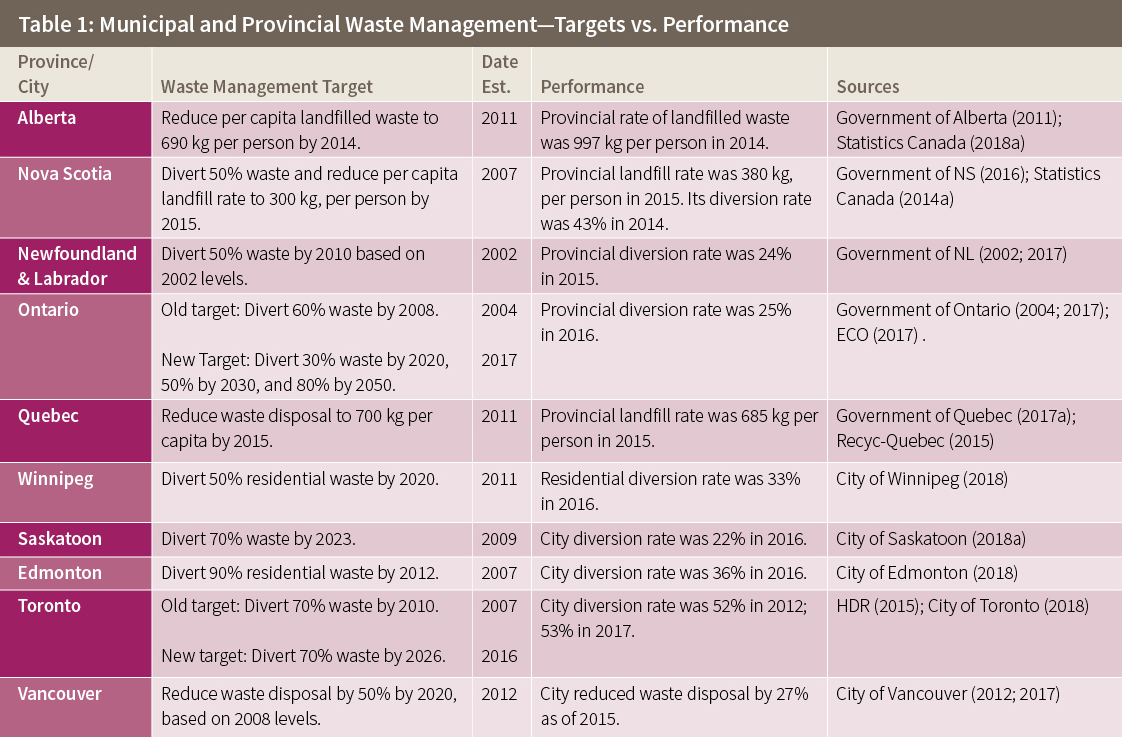
Table 1: Municipal and Provincial Waste Management—Targets vs. Performance
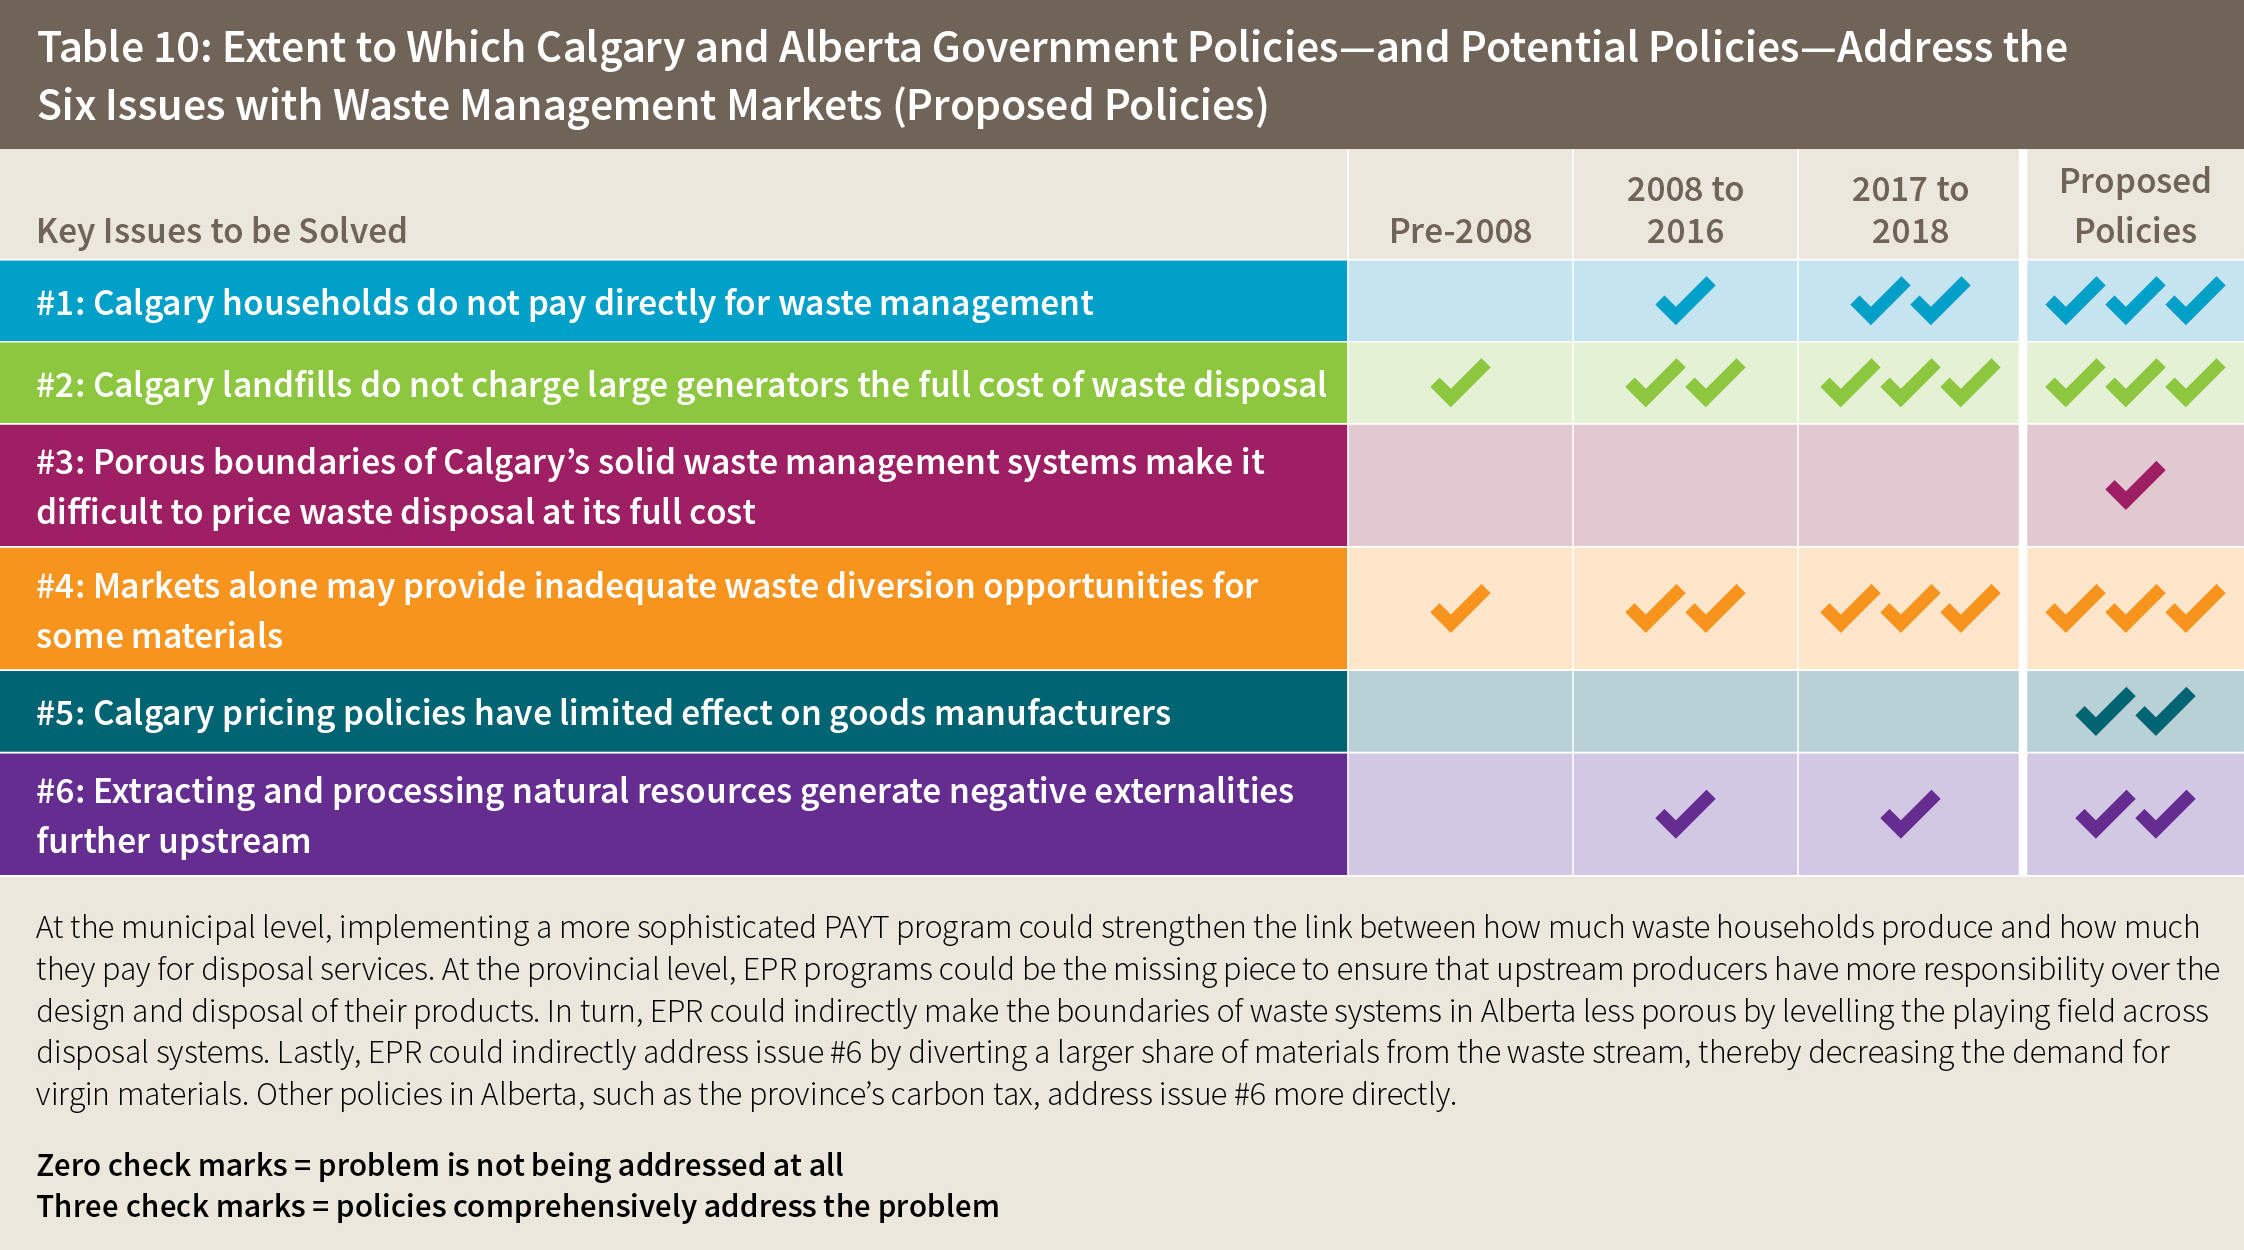
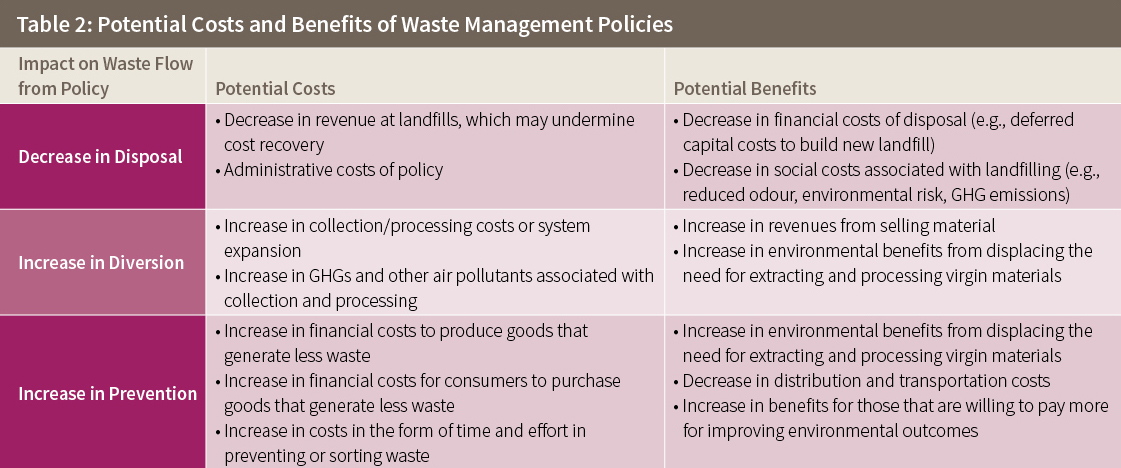
Table 2: Potential Costs and Benefits of Waste Management Policies
Table 3: Six Key Issues with Solid Waste Management Systems
Table 4: System Efficiency Impacts from Different PAYT Program Designs
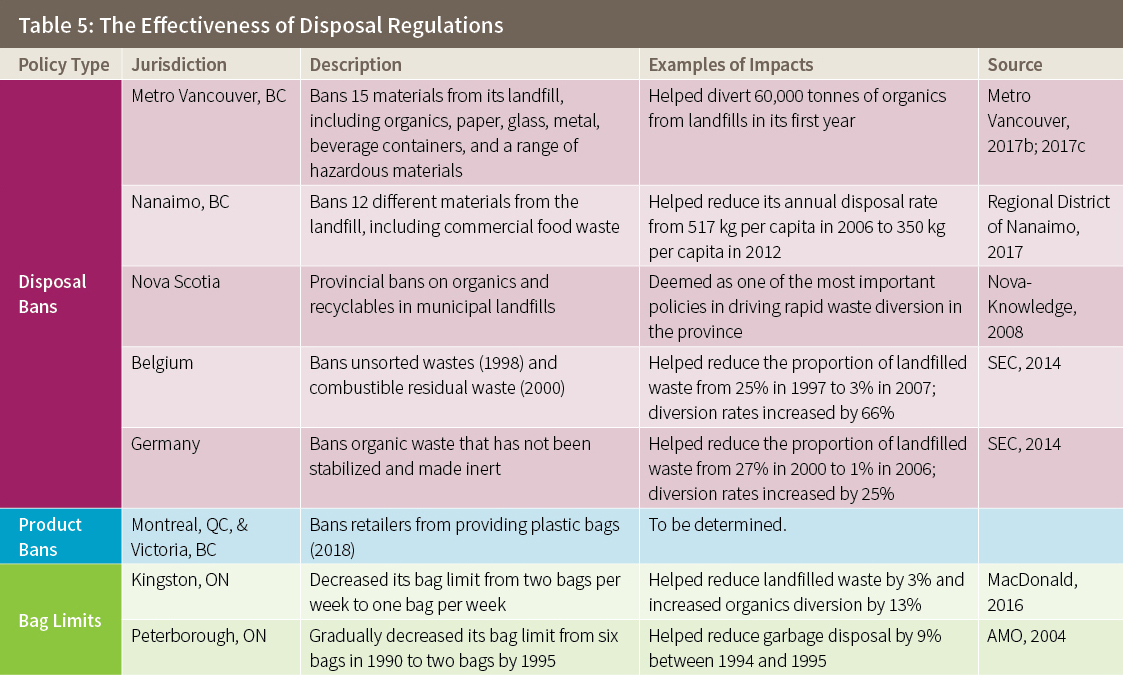
Table 5: The Effectiveness of Disposal Regulations
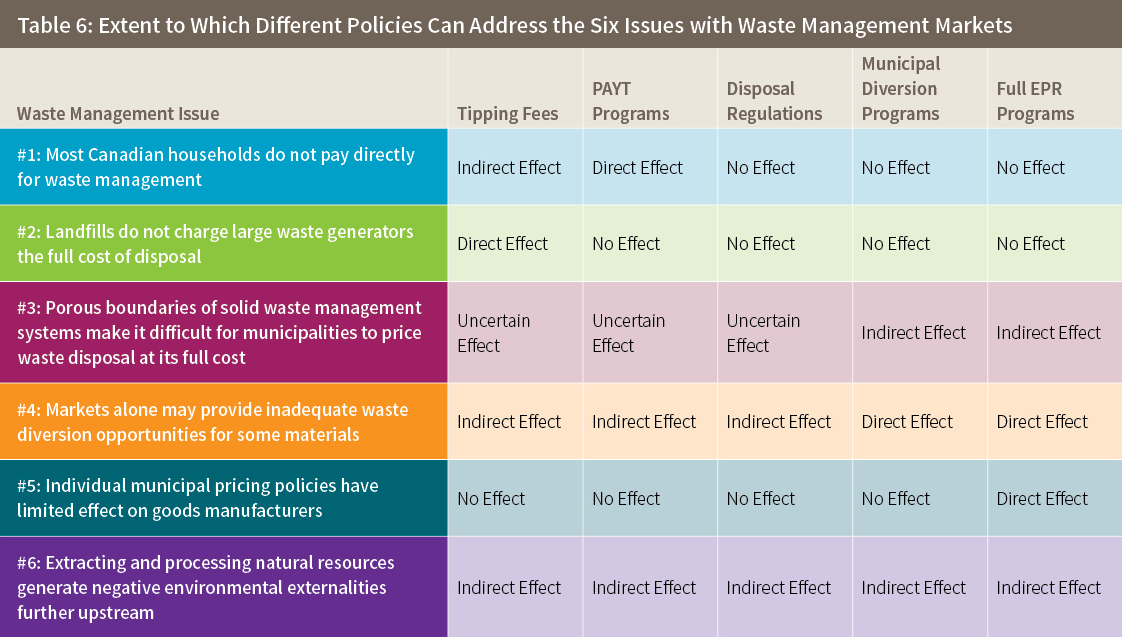
Table 6: Extent to Which Different Policies Can Address the Six Issues with Waste Management Markets
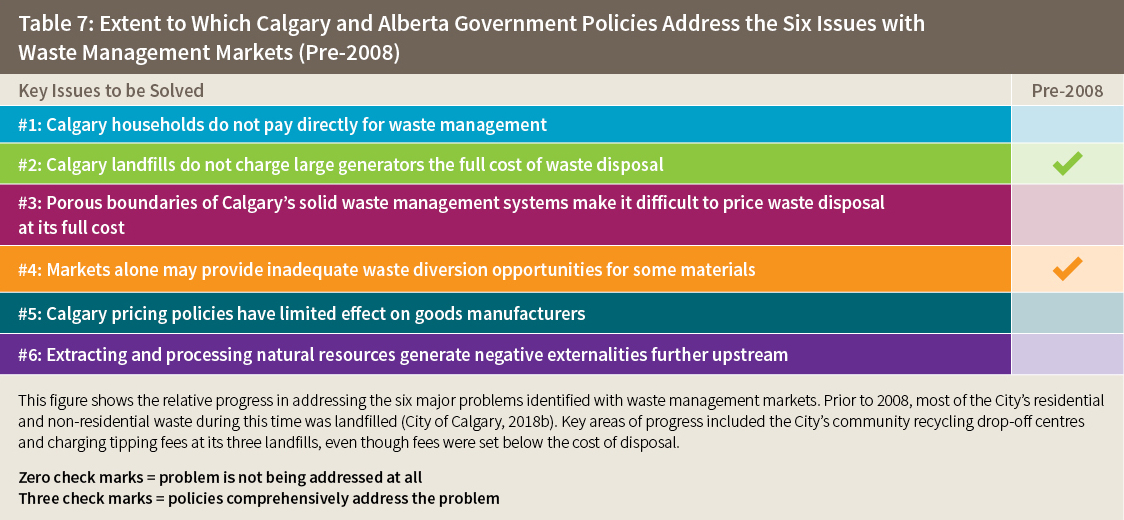
Table 7: Extent to Which Calgary and Alberta Government Policies Address the Six Issues with Waste Management Markets (Pre-2008)
Table 7: Extent to Which Calgary and Alberta Government Policies Address the Six Issues with
Waste Management Markets (Pre-2008)
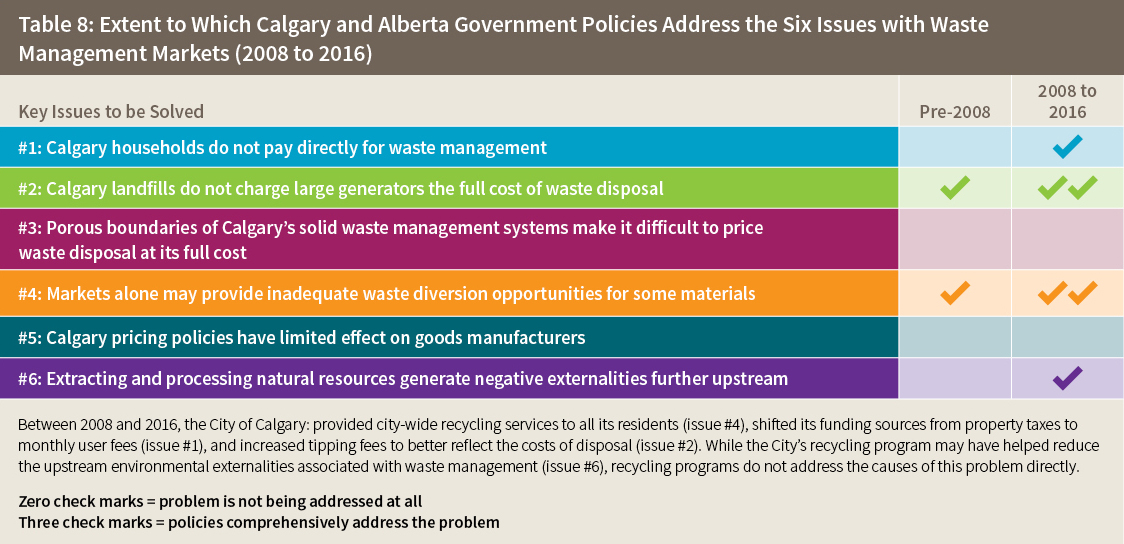
Table 8: Extent to Which Calgary and Alberta Government Policies Address the Six Issues with Waste Management Markets (2008 to 2016)
Table 8: Extent to Which Calgary and Alberta Government Policies Address the Six Issues with Waste
Management Markets (2008 to 2016)
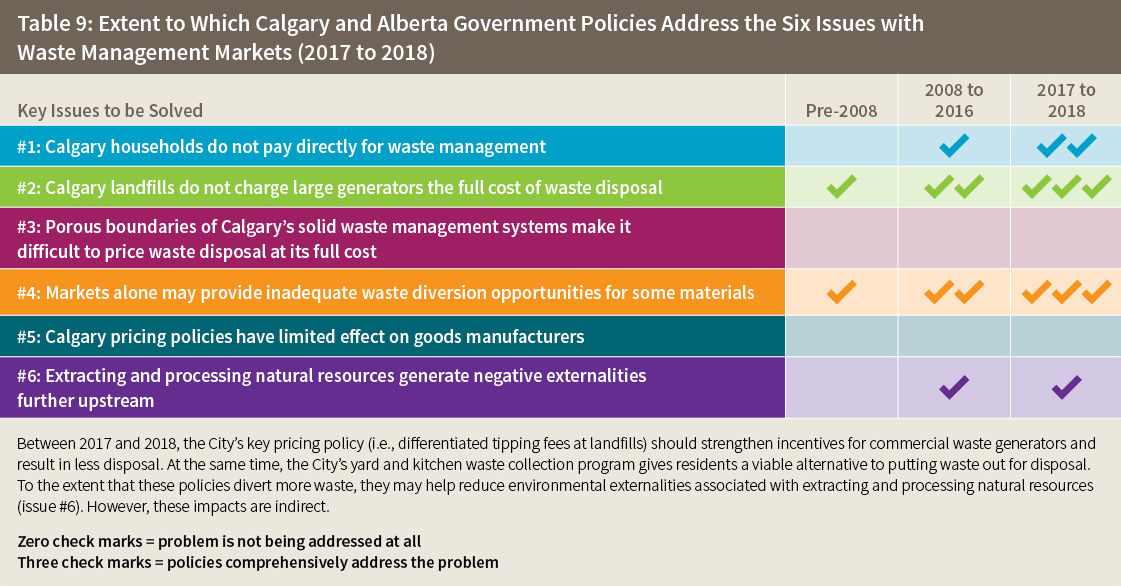
Table 9: Extent to Which Calgary and Alberta Government Policies Address the Six Issues with Waste Management Markets (2017 to 2018)
Table 9: Extent to Which Calgary and Alberta Government Policies Address the Six Issues with
Waste Management Markets (2017 to 2018)
Table 10: Extent to Which Calgary and Alberta Government Policies—and Potential Policies—Address the Six Issues with Waste Management Markets (Proposed Policies)
Table 10: Extent to Which Calgary and Alberta Government Policies—and Potential Policies—Address the
Six Issues with Waste Management Markets (Proposed Policies)