Figures et tableaux

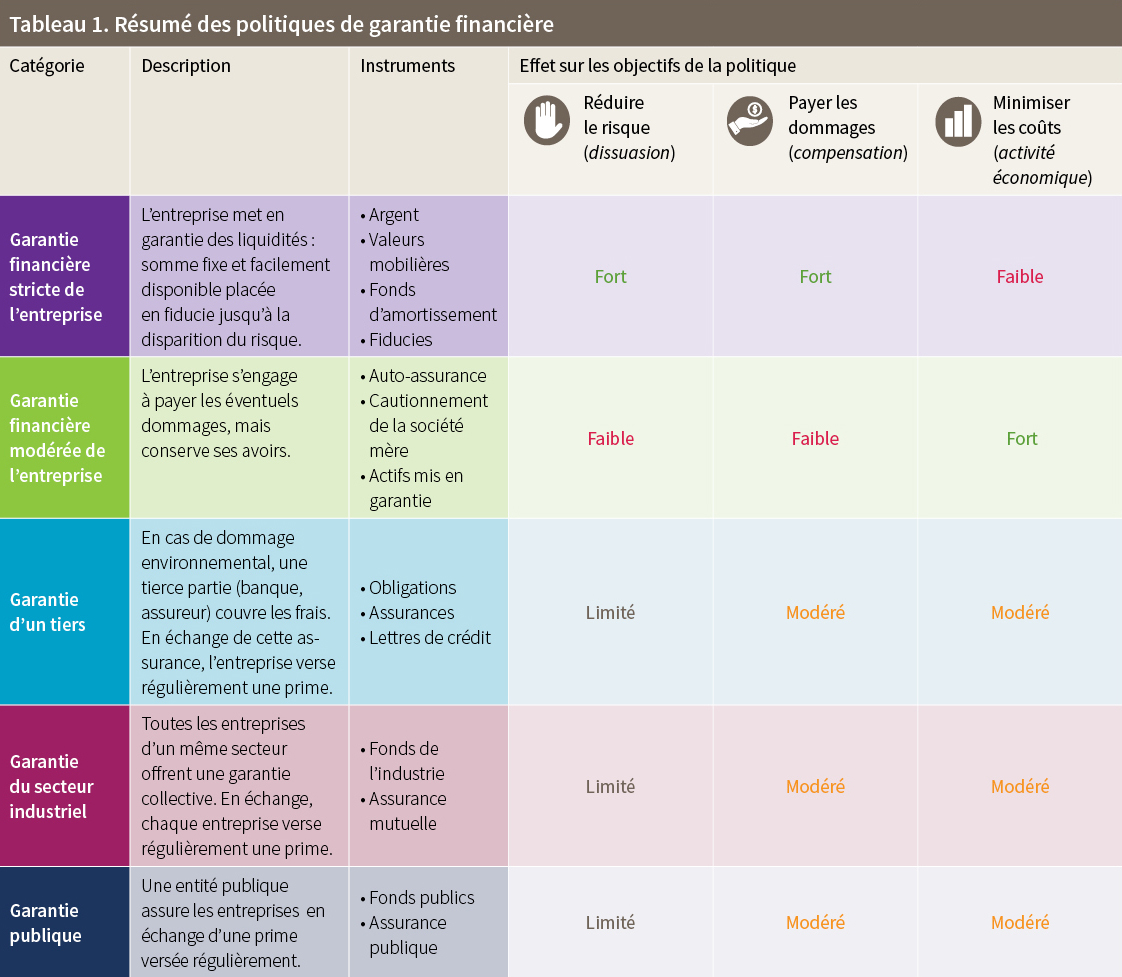
Tableau 1

Tableau 1. Résumé des politiques de garantie financière

Figures (en anglais)

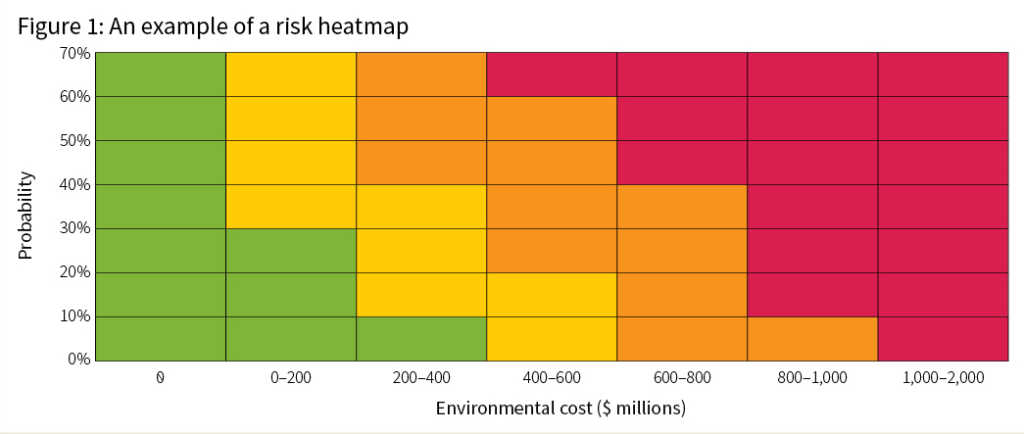
Figure 1: An example of a risk heatmap


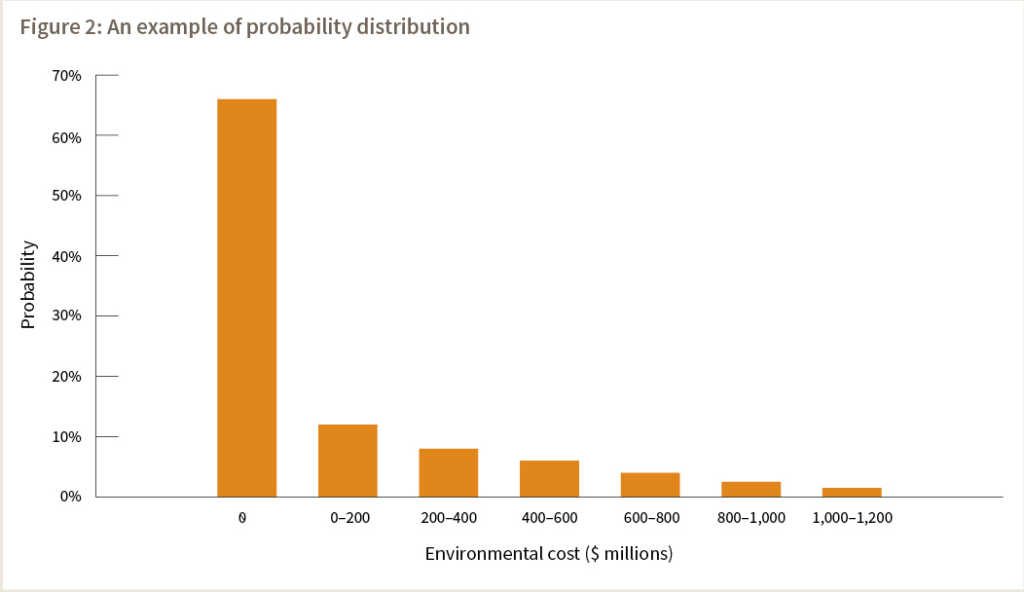
Figure 2: An example of probability distribution
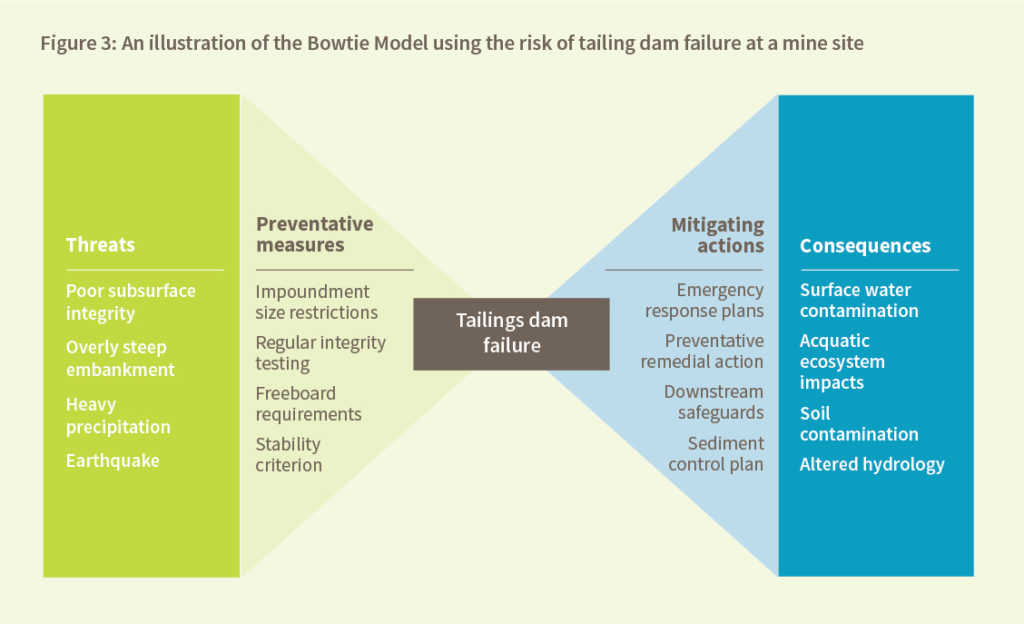
Figure 3: An illustration of the Bowtie Model using the risk of tailing dam failure at a mine site
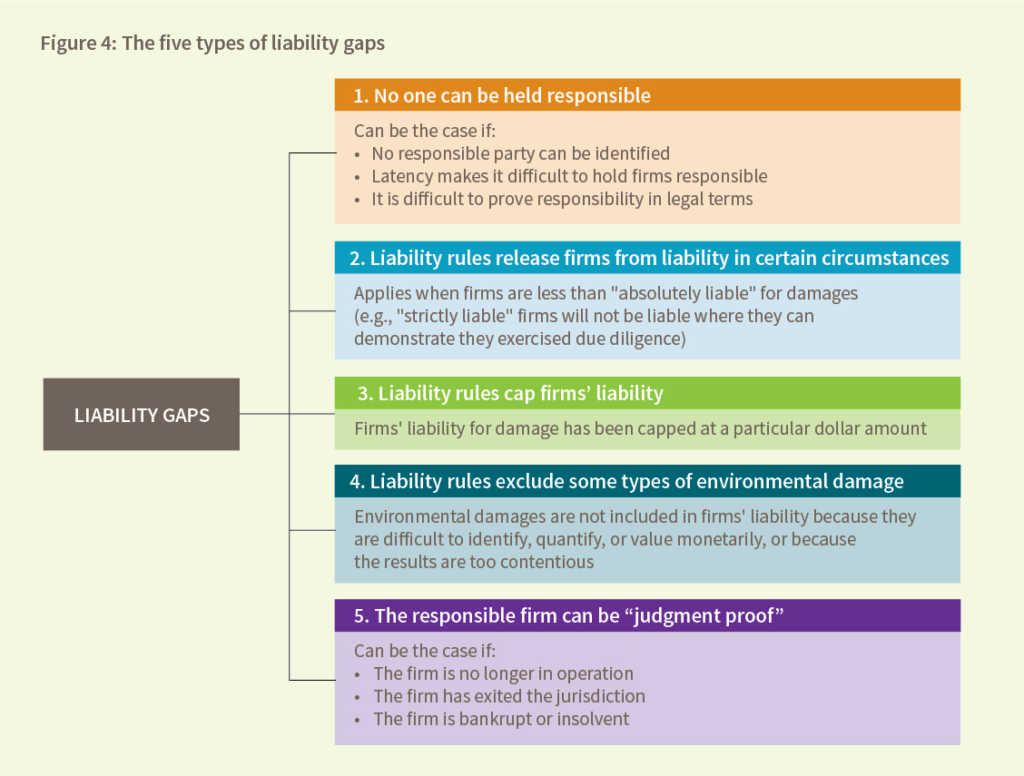
Figure 4: The five types of liability gaps
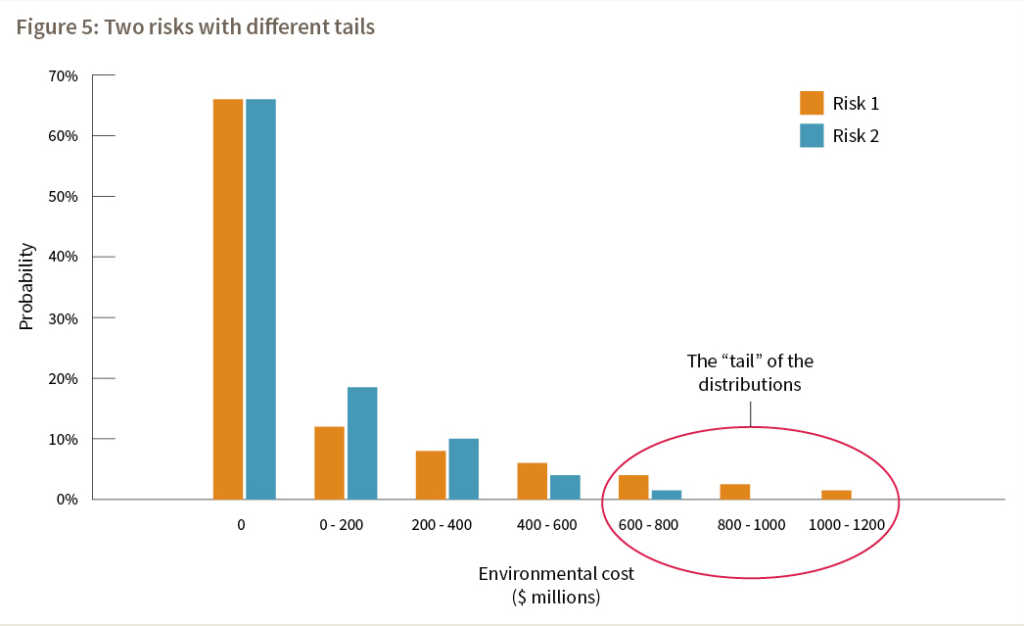
Figure 5: Two risks with different tails

Tables (en anglais)

Table 1: Summary of financial assurance instruments
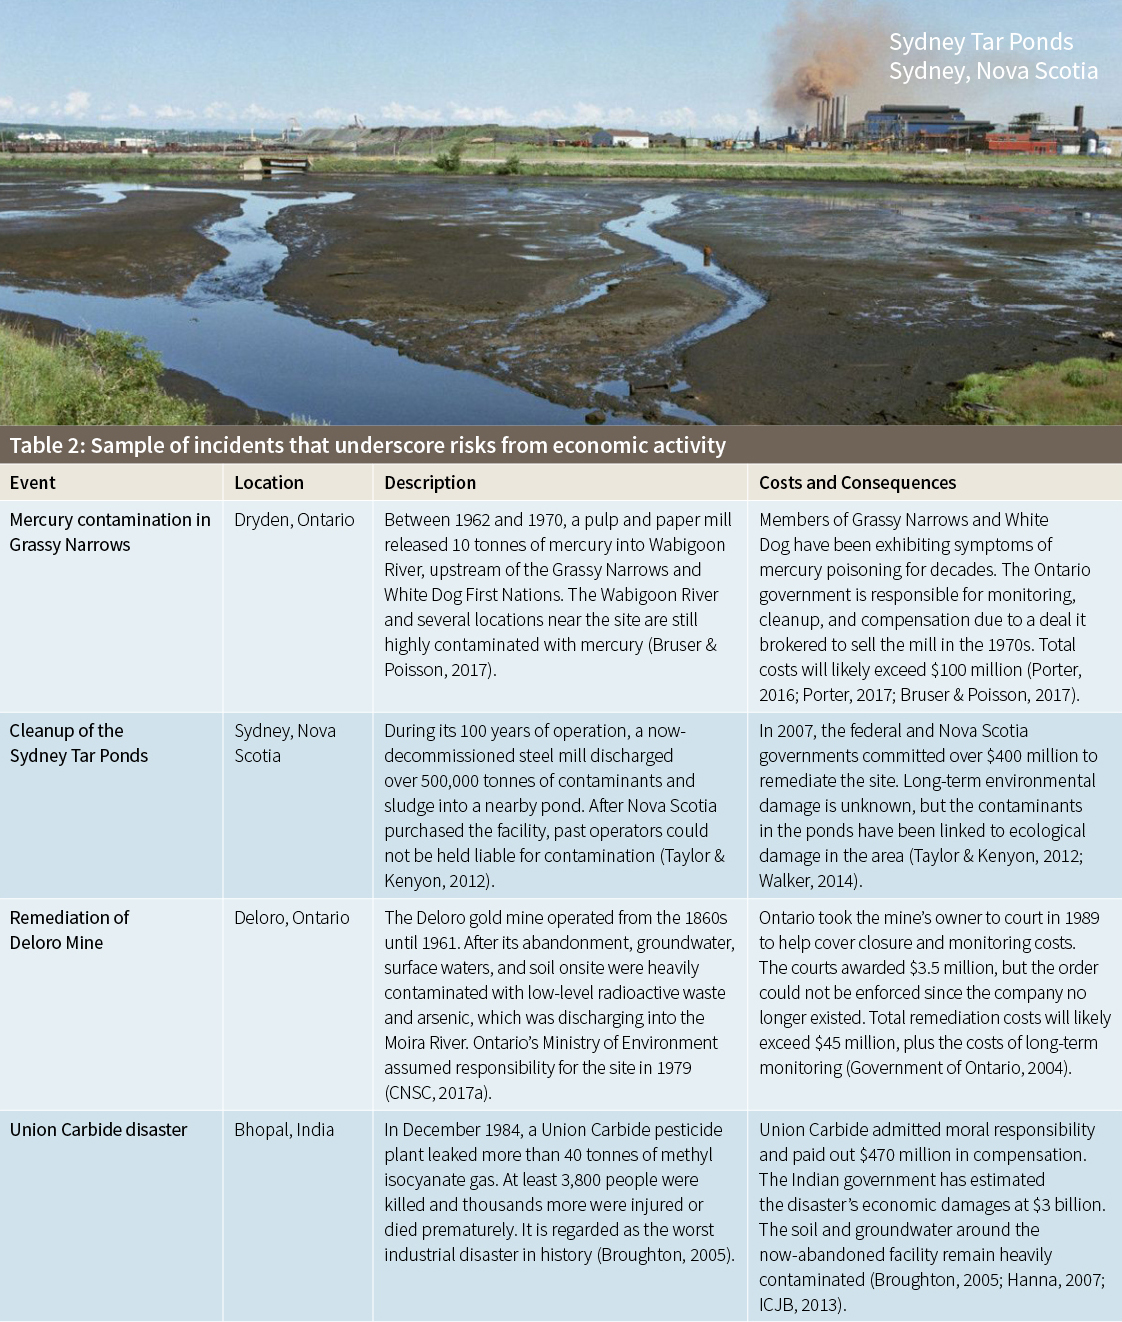
Table 2A: Sample of incidents that underscore risks from economic activity
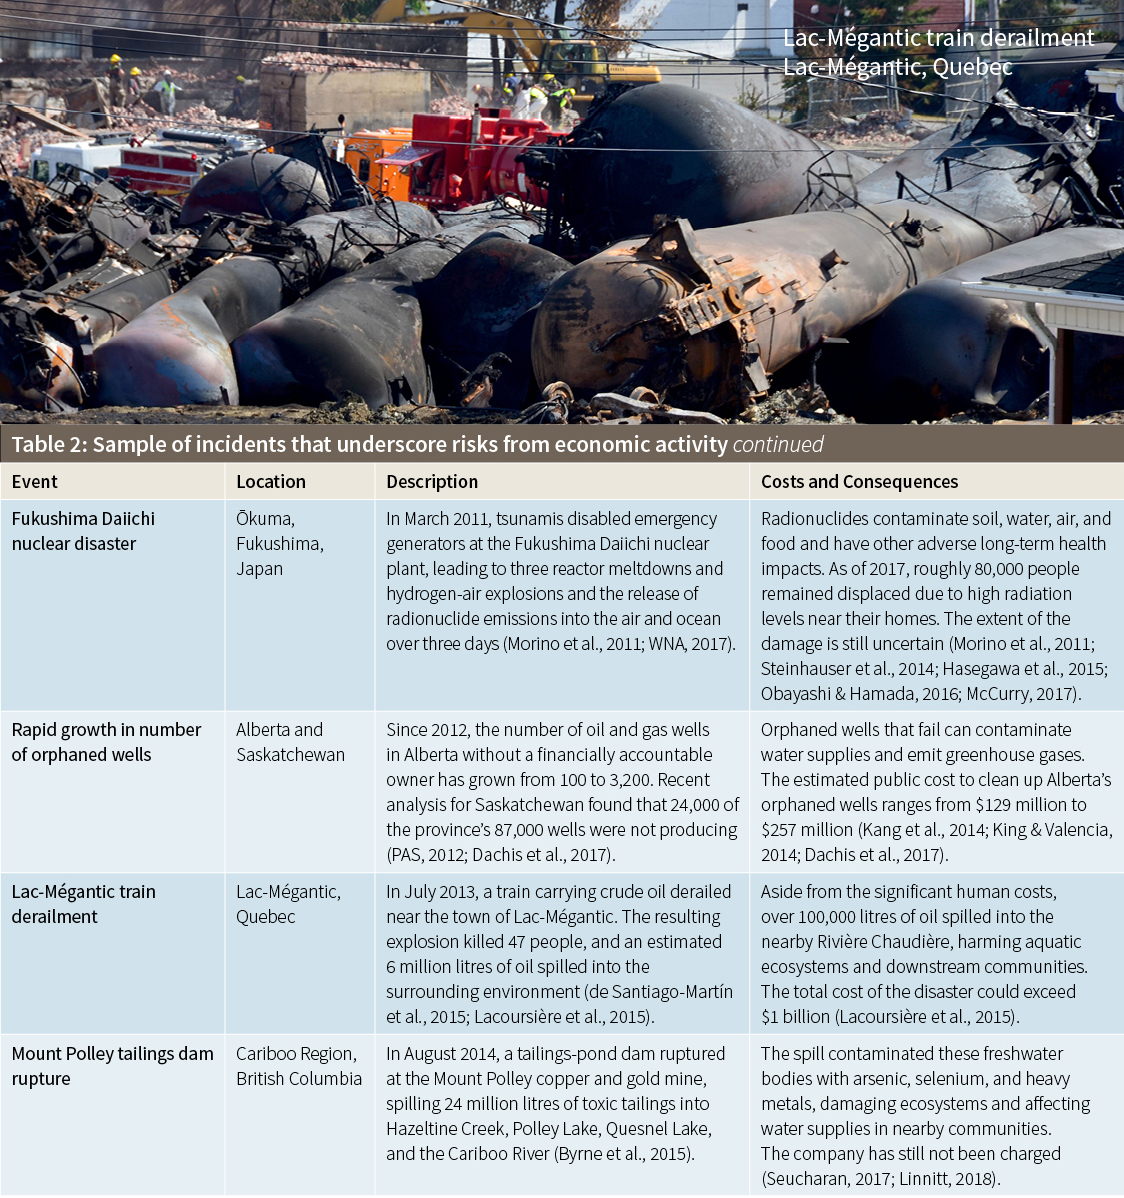
Table 2B: Sample of incidents that underscore risks from economic activity
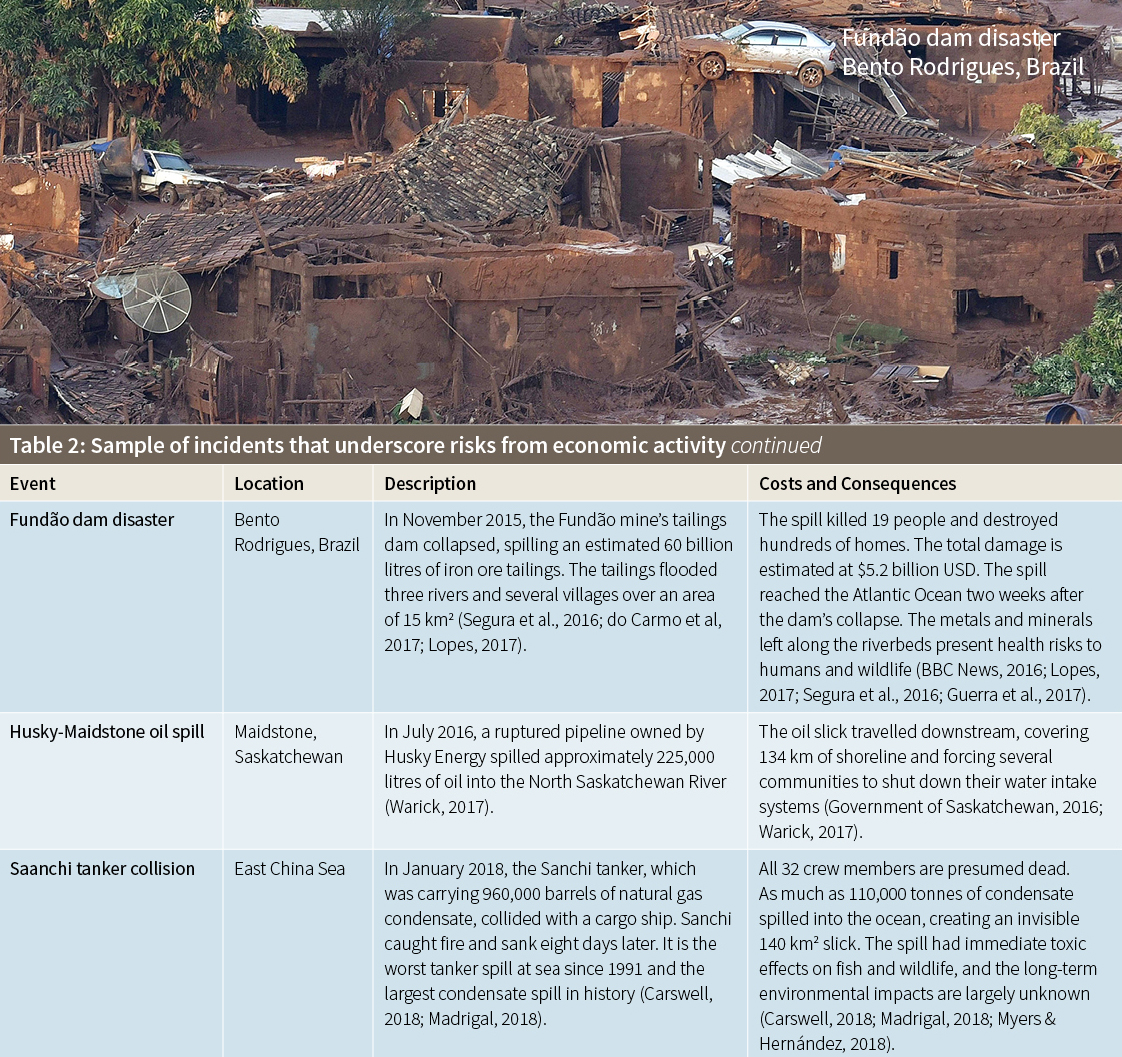
Table 2C: Sample of incidents that underscore risks from economic activity
Table 2D: Sample of incidents that underscore risks from economic activity
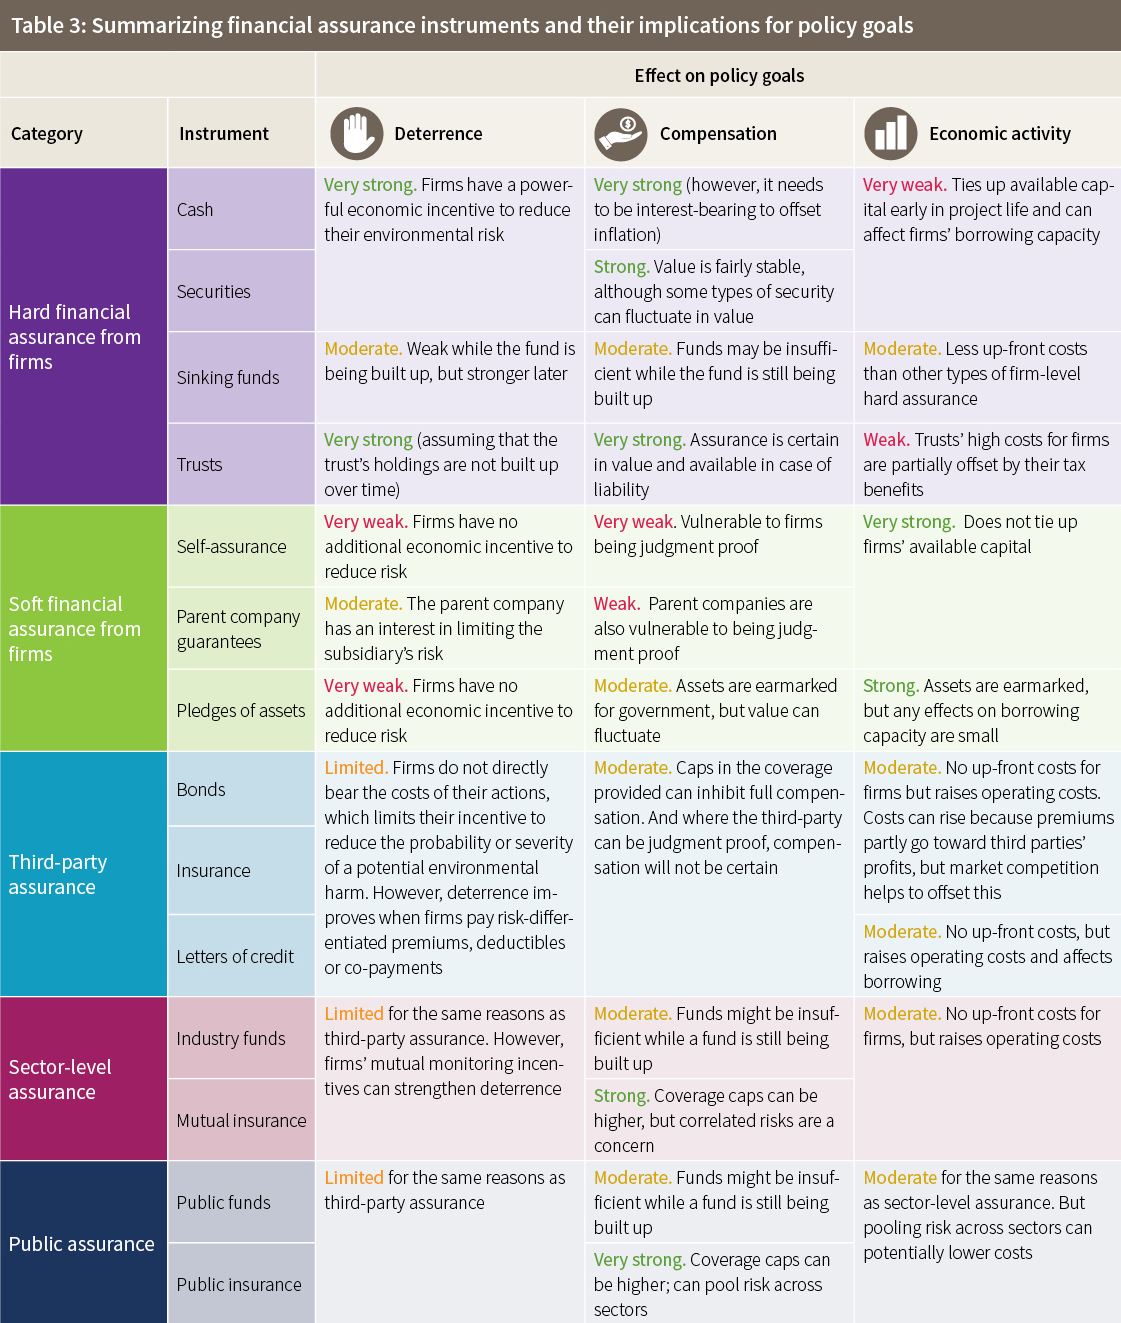
Table 3: Summarizing financial assurance instruments and their implications for policy goals
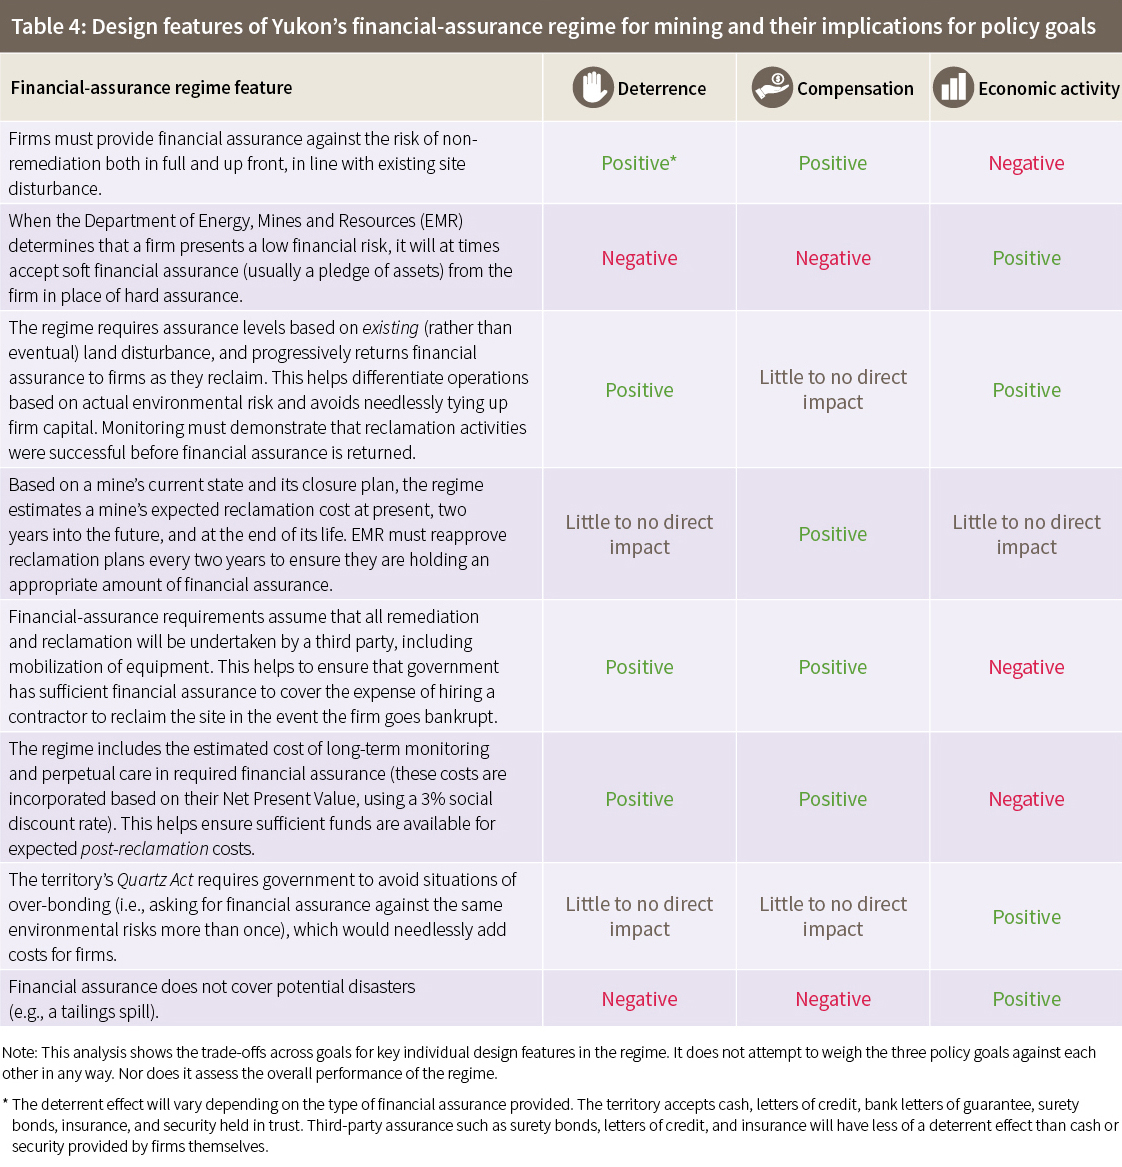
Table 4: Design features of Yukon’s financial-assurance regime for mining and their implications for policy goals
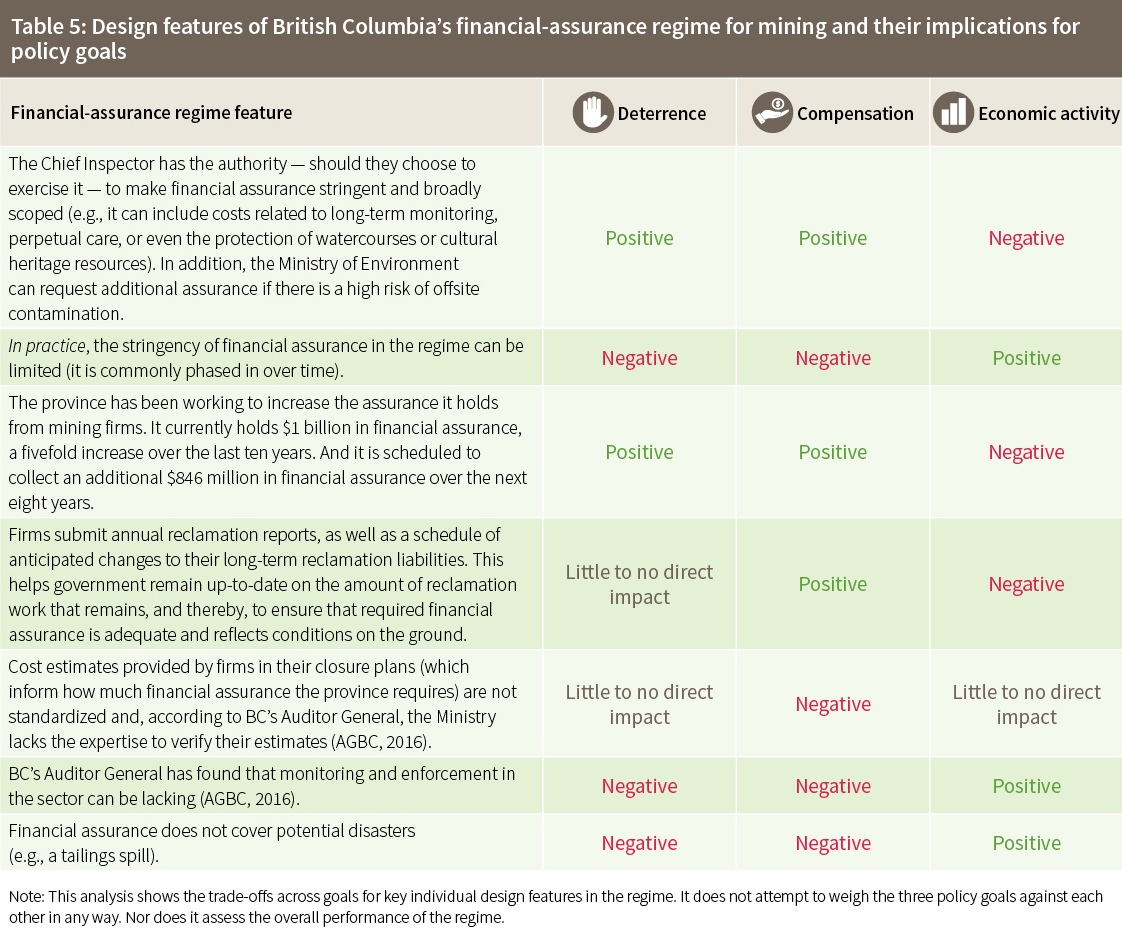
Table 5: Design features of British Columbia’s financial-assurance regime for mining and their implications for
policy goals
Table 6: Design features of Alberta’s financial-assurance regime for mining and their implications for policy goals
Table 7: Design features of Ontario’s financial-assurance regime for mining and their implications for policy goals
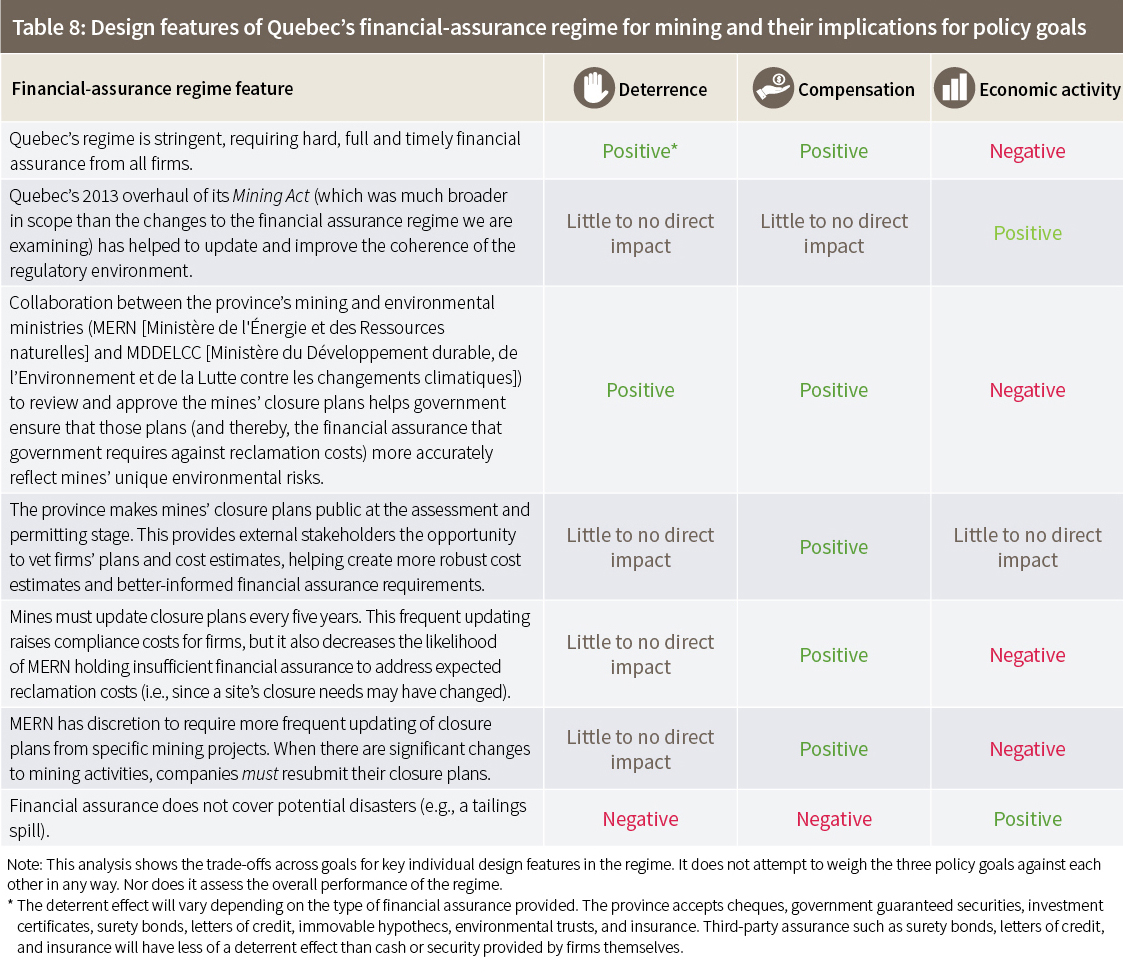
Table 8: Design features of Quebec’s financial-assurance regime for mining and their implications for policy goals

Send this to friend